Introduction
Charts (or also known as graphs) are graphical representations of data, in which the data is represented by symbols such as bars in bar graphs. In JavaScript, we already have popular third-party libraries such as D3, Chart.js and ECharts to help us create charts or graphs in a simple and customizable way with lots of features that come with it.
A few months ago, I had a requirement from our product team to build a bar graph that can display both positive and negative values. Though it's so easy to use one of the libraries to implement the requirement, I decided to build the bar graph on my own because I thought the requirement was not too complicated and the data is not that big. If I use one of these libraries then it might be an overkill where we're not able to utilize all the features. We are especially conscious about the size that gets added into our assets when we install a third-party library because the bigger the size of our JavaScript files, the slower our page gets loaded.
Every developer has their own way of building things, I definitely don't think my solution is the best way - but it was the solution that made the most sense to me. I'm not going to use Canvas to build the bar graph and most will argue that I should use it because that's more efficient for drawing graphics and I agree on that. But the reason why I chose to build it with just regular HTML and CSS is because I find it more simpler and flexible to implement the expected bar graph. I also mentioned earlier that the data we need to display is not that big. Based on the requirement, we only needed to display four bars in the bar graph. The bar graph I implemented in this post may not exactly fit your requirement but I hope you'll still learn something from this post to help you build it or something similar. Like my other React and TypeScript with test posts or tutorials, this is also a good way for you to practice and learn TypeScript and writing tests with Jest and Testing Library if you're still new to them. So without further ado, let's get started!
Prerequisites
This is the link to the bar graph component which we'll accomplish by the end of this post, you can see and play around with it or use it as your reference throughout this tutorial.
Upon writing this post, I assume that you have some web development background and basic knowledge regarding npm, yarn, HTML, CSS, JavaScript and React.
Make sure to install Yarn in your system if you haven't. We will use Yarn as our package manager, it's just like npm but faster.
I've written a separate post about the IDE and extensions I use to help save time and energy when writing code in React. I highly suggest that you check it out if you haven't!
Initialize your project
Fastest way to start a new project with React is using the Create React App. It is an officially supported way to create single-page React applications. It offers a modern build setup with no configuration so you can focus on code, not build tools.
To create our project with React and TypeScript, run this command in your terminal:
yarn create react-app react-typescript-bar-graph --template typescript
Once project is initiated, install the additional package below:
cd react-typescript-bar-graph
yarn add classnames
The classnames library we just installed will help us with joining classNames together conditionally. You'll get to see how we'll use this later on.
To run our project, execute the command below:
yarn start
This command will open your default browser and direct you to http://localhost:3000/. If it doesn't, you can do it yourself too.
This setup comes with live-editing or hot reloading which means when we save file changes, it will automatically update the app and reload on the browser. That's great for local development!
Clean up the project
We're ready to code! Let's clean up our project which was created by Create React App. We won't be needing some of them. Delete or clear the contents of the following below:
- src/App.css (clear contents)
- src/App.test.tsx (delete)
- src/logo.svg (delete)
Then let's update the code in src/App.tsx:
import './App.css';

export default function App() {
  return (
    <div className="container">
      <h1>React TypeScript Bar Graph</h1>
    </div>
  );
}
We will use the App component as the container of our bar graph component. Next, add the following styles in src/App.css:
.container {
  width: 100%;
  max-width: 800px;
  margin: 0 auto;
  padding: 20px 15px;
}
Then let's also update the styles in src/index.css:
* {
  box-sizing: border-box;
}

body {
  margin: 0;
  font-family: -apple-system, BlinkMacSystemFont, 'Segoe UI', 'Roboto',
    'Oxygen', 'Ubuntu', 'Cantarell', 'Fira Sans', 'Droid Sans',
    'Helvetica Neue', sans-serif;
  -webkit-font-smoothing: antialiased;
  -moz-osx-font-smoothing: grayscale;
}
Create BarItem component
In a bar graph, it consists of bars. So let's start with creating the component of a single bar and call it the BarItem component. We can reuse this component later inside of a bar graph.
First, create a folder called components under the src folder. I usually like to group the components I create inside this folder for easier reference. Inside the components folder, create the JSX file and name it BarItem.tsx. The path for this new file should be src/components/BarItem.tsx. If you're new to TypeScript, you will notice that the extension we used for JSX is .tsx instead of .jsx. This is the TypeScript extension for JSX and that is how the TypeScript compiler will know which files to enforce TypeScript rules and transpile its source code to JavaScript.
Once the file is created, add the following code below in src/components/BarItem.tsx:
import React from 'react';
import './BarItem.css';

export default function BarItem() {
  return <div className="bar-item"></div>;
}
Then, let's style our BarItem component by creating the CSS file src/components/BarItem.css and add the styles below:
.bar-item {
  flex: 1;
  height: 100%;
  background-color: #f2f2f2;
  border-top-right-radius: 4px;
  border-top-left-radius: 4px;
}

.bar-item:hover {
  background-color: #54d6da;
}
We're going to use the Flexbox layout system which is a one-dimensional layout method for arranging items in rows or columns, perfect for creating our bar graph. The flex CSS shorthand property sets how a flex item will grow or shrink to fit the space available in its flex container.
Create BarGraph component
Next, let's now proceed to create the component for our bar graph and call it the BarGraph component. The bar graph will be the container for our BarItem components and it will handle the calculation of the percentages of each bar. It will also contain a line bar that acts as the base of our graph - do note that the line bar will rise above the base if there are negative values in one of the bars. Do not worry about these logics for now and let's focus first on creating the HTML structure and the styles of our bar graph.
Create the JSX file with the path src/components/BarGraph.tsx and add the following code:
import React from 'react';
import BarItem from './BarItem';
import './BarGraph.css';

export default function BarGraph() {
  return (
    <div className="bar-graph">
      <div className="bars-list">
        <BarItem />
        <BarItem />
        <BarItem />
        <BarItem />
      </div>
      <div className="bars-line" />
    </div>
  );
}
Then, create a CSS file with the path src/components/BarGraph.css to style our BarGraph component. Add the following styles below:
.bar-graph {
  position: relative;
  width: 100%;
  max-width: 400px;
  height: 170px;
}

.bars-list {
  display: flex;
  align-items: flex-end;
  column-gap: 20px;
  width: 100%;
  height: 100%;
}

.bars-line {
  position: absolute;
  bottom: 0;
  left: 0;
  width: 100%;
  height: 1px;
  background-color: #505050;
  opacity: 0.5;
  pointer-events: none;
}
The BarGraph component is now ready to be imported and used in the App component. Let's update src/App.tsx with the following code changes:
import './App.css';
import BarGraph from './components/BarGraph';

export default function App() {
  return (
    <div className="container">
      <h1>React TypeScript Bar Graph</h1>
      <BarGraph />
    </div>
  );
}
After saving the changes, this is what you should see on your React application:
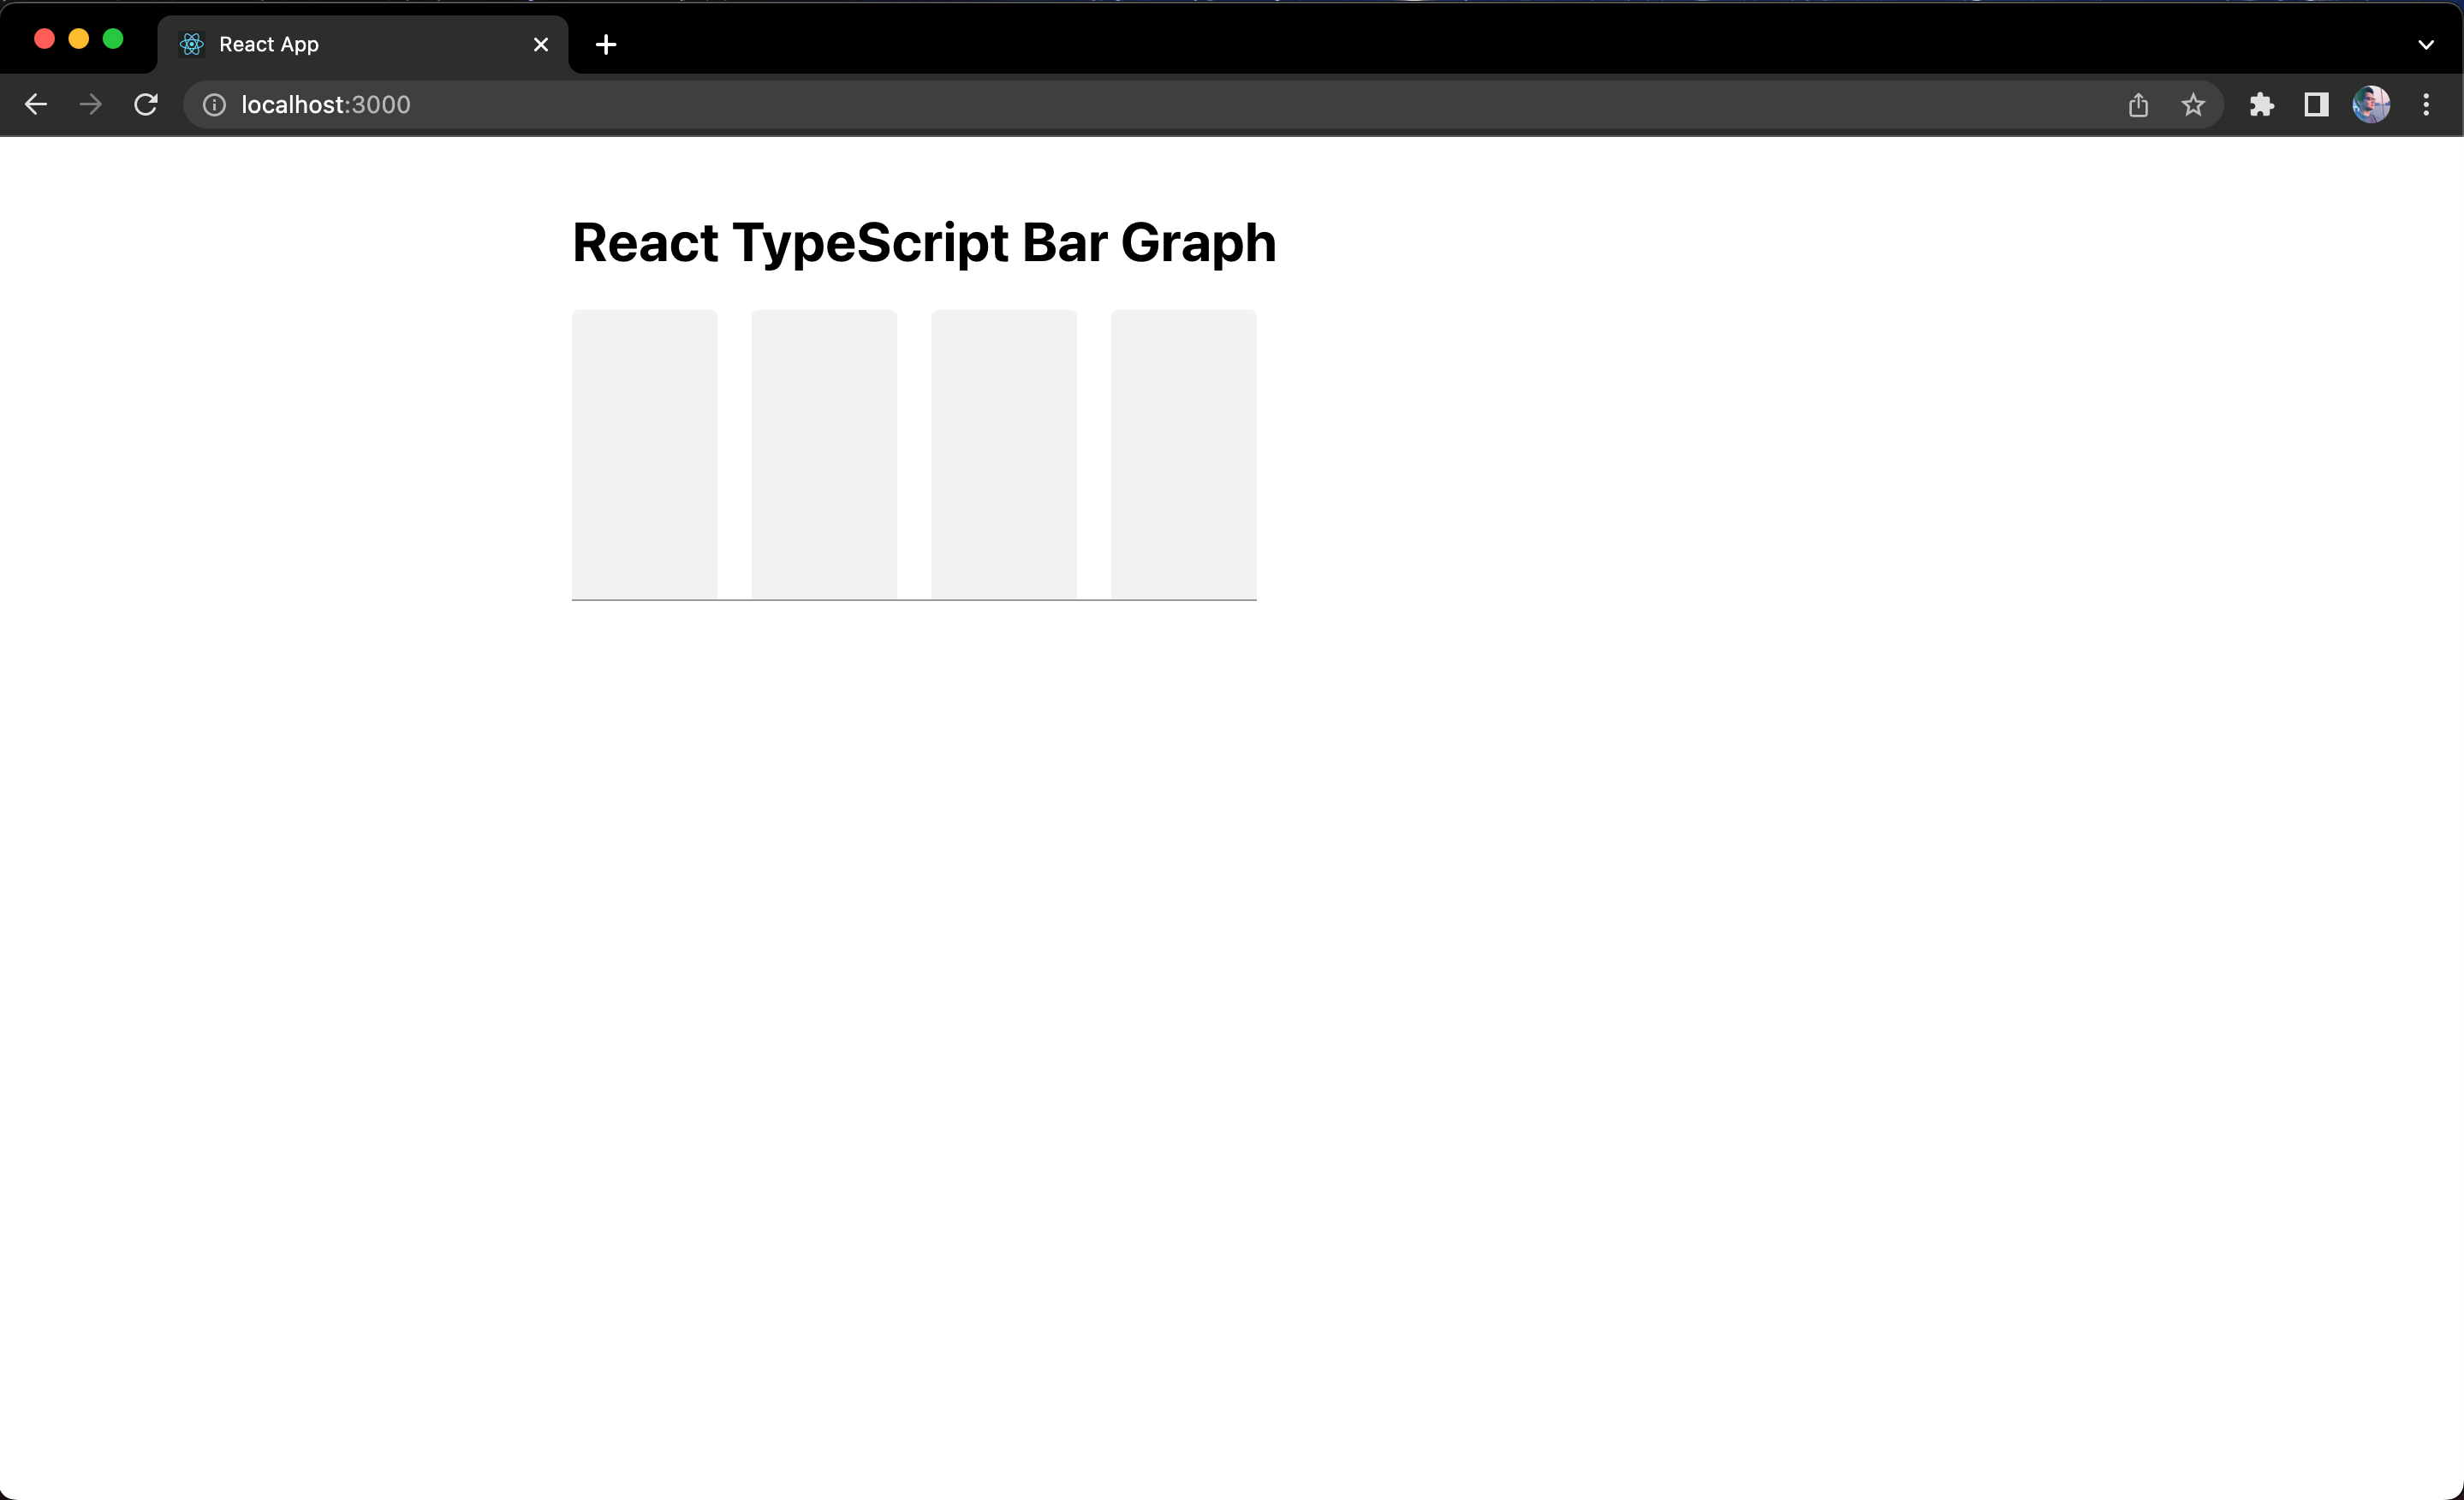
Great! We now have the first look of our bar graph.
Implement bar legend
To make our bar graph a little more informational, let's add a legend for each of the bars which represents a caption for the content of it.
Let's update the BarItem component in src/components/BarItem.tsx with the following:
import React from 'react';
import './BarItem.css';

export default function BarItem(props) {
  return (
    <div className="bar-item">
      <div className="bar-item-legend">{props.legend}</div>
    </div>
  );
}
When you apply the changes, you should see a squiggly underline on the component "props" (which stands for properties) object argument. When you hover on it, you should see the TypeScript error message: Parameter 'props' implicitly has an 'any' type. This means we didn't explicitly define the type for the "props" and that will potentially cause errors later on. Let's fix this by defining the type:
...
export default function BarItem(props: { legend: string }) {
  return (
    ...
  );
}
If you're new to TypeScript, this is how we define a type. We first add a colon : right after the variable or argument we are defining a type of. Since "props" is an object, hence our type is also wrapped with the curly braces {} that make it an object. Inside the object, we define the keys or properties we require for our "props", which in this case is the legend key or property. Again, we add a colon : right after it and define the type it should accept which in this case legend should be a string. The type string is one of the very commonly used primitives apart from number and boolean.
We've used object types by writing them directly in type annotations. This is convenient, but it's common to want to use the same type more than once and refer to it by a single name. You can also extract the type and declare it like a variable like this:
...
export type Props = {
  legend: string;
};

export default function BarItem(props: Props) {
  return (
    ...
  );
}
This is what we call a Type Alias. Now that the Props type is exported, it can be reused by other files such as test files which we'll do later on.
After saving the changes, you will get a new error from the BarGraph component with the following message: Property 'legend' is missing in type '{}' but required in type 'Props'.
You can already see how useful TypeScript is and how helpful it would be when debugging at this early stage rather than later on.
We can fix the error by updating src/components/BarGraph.tsx with the following code:
...
export default function BarGraph() {
  return (
    <div className="bar-graph">
      <div className="bars-list">
        <BarItem legend="Year 1" />
        <BarItem legend="Year 2" />
        <BarItem legend="Year 3" />
        <BarItem legend="Thereafter" />
      </div>
      <div className="bars-line" />
    </div>
  );
}
Then, let's add the style of the legends in src/components/BarItem.css:
.bar-item {
  ...
  position: relative;
}

...

.bar-item-legend {
  position: absolute;
  top: 100%;
  width: 100%;
  padding-top: 10px;
  color: #999999;
  font-size: 12px;
  line-height: 14px;
  text-align: center;
}

.bar-item:hover .bar-item-legend {
  color: #2c2c2c;
}
Once you save the changes, you should see that each of the bar has a legend right below them:
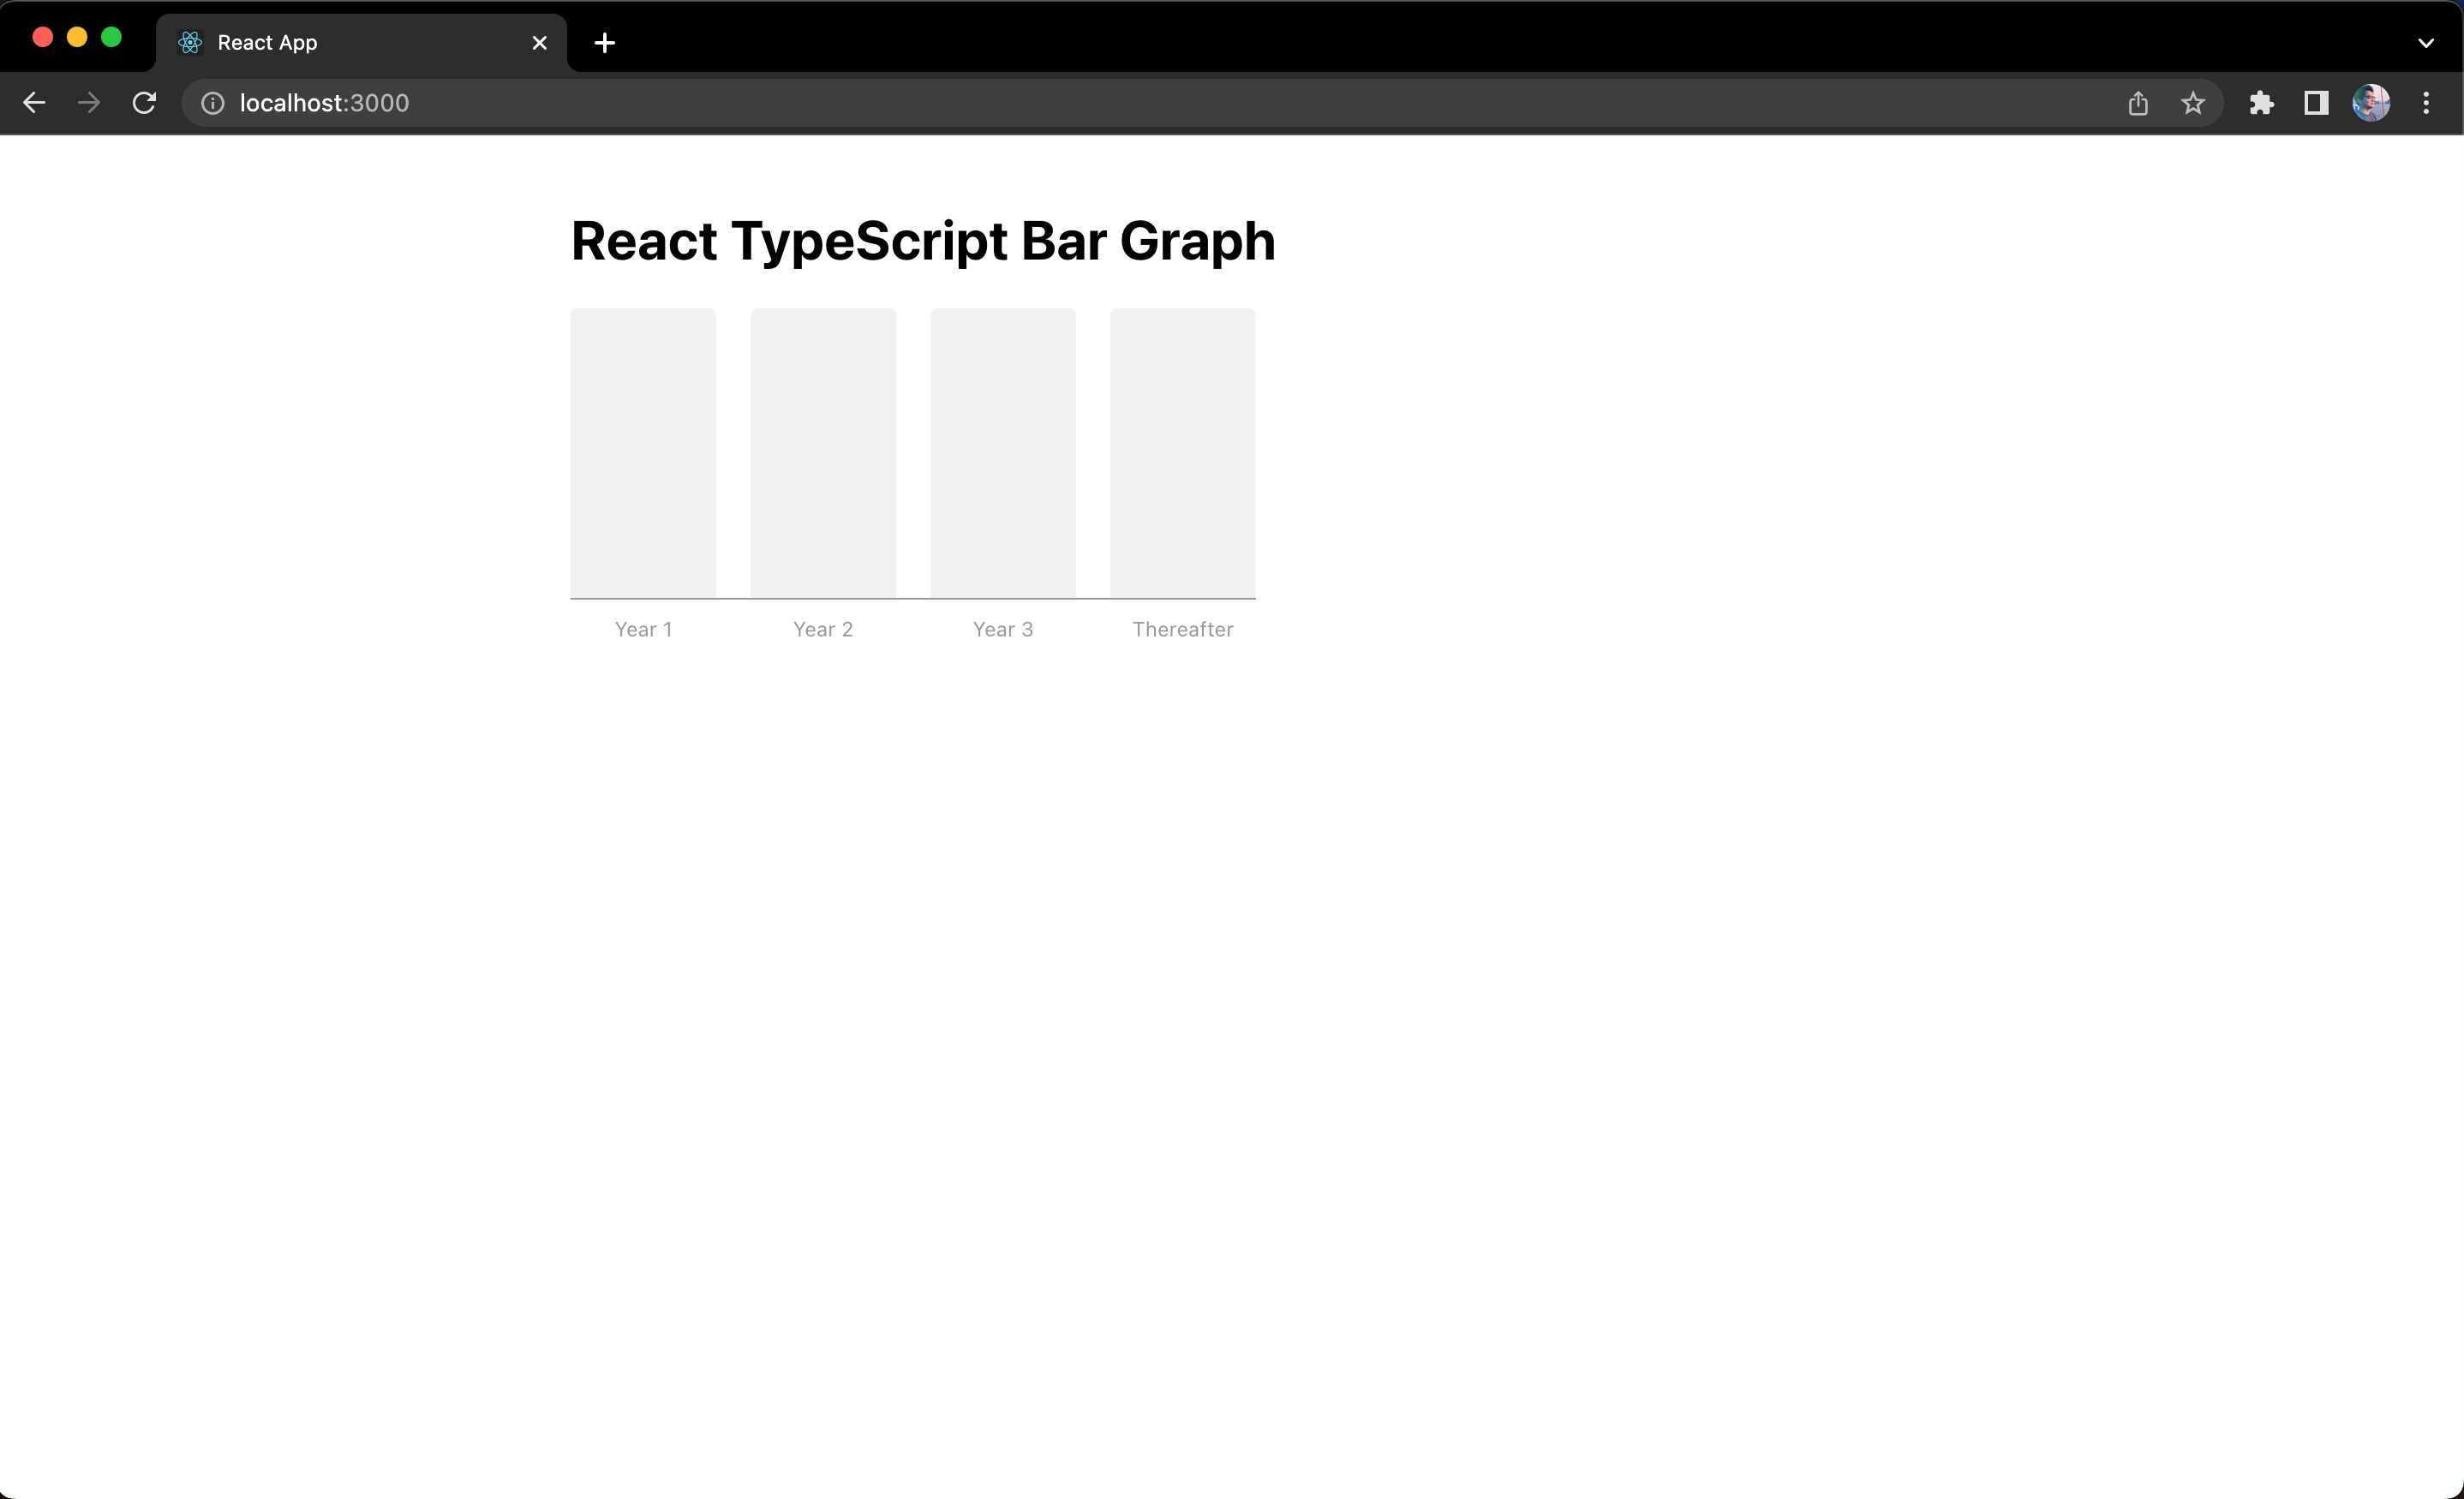
Our bar graph is looking great so far!
Display bars based on their value
When we display graphs such as a bar graph, we normally use percentages to represent each bar. To implement the percentage for each bar, it's not as straightforward as you might think. This is because we want to display bars with negative values as well which makes this post interesting, at least for me. If it's just positive values, it will be straightforward and we just have to define the value of the height CSS property of the bar with the percentage we calculated. But the height CSS property can't accept negative percentage and hence that's where the complication is.
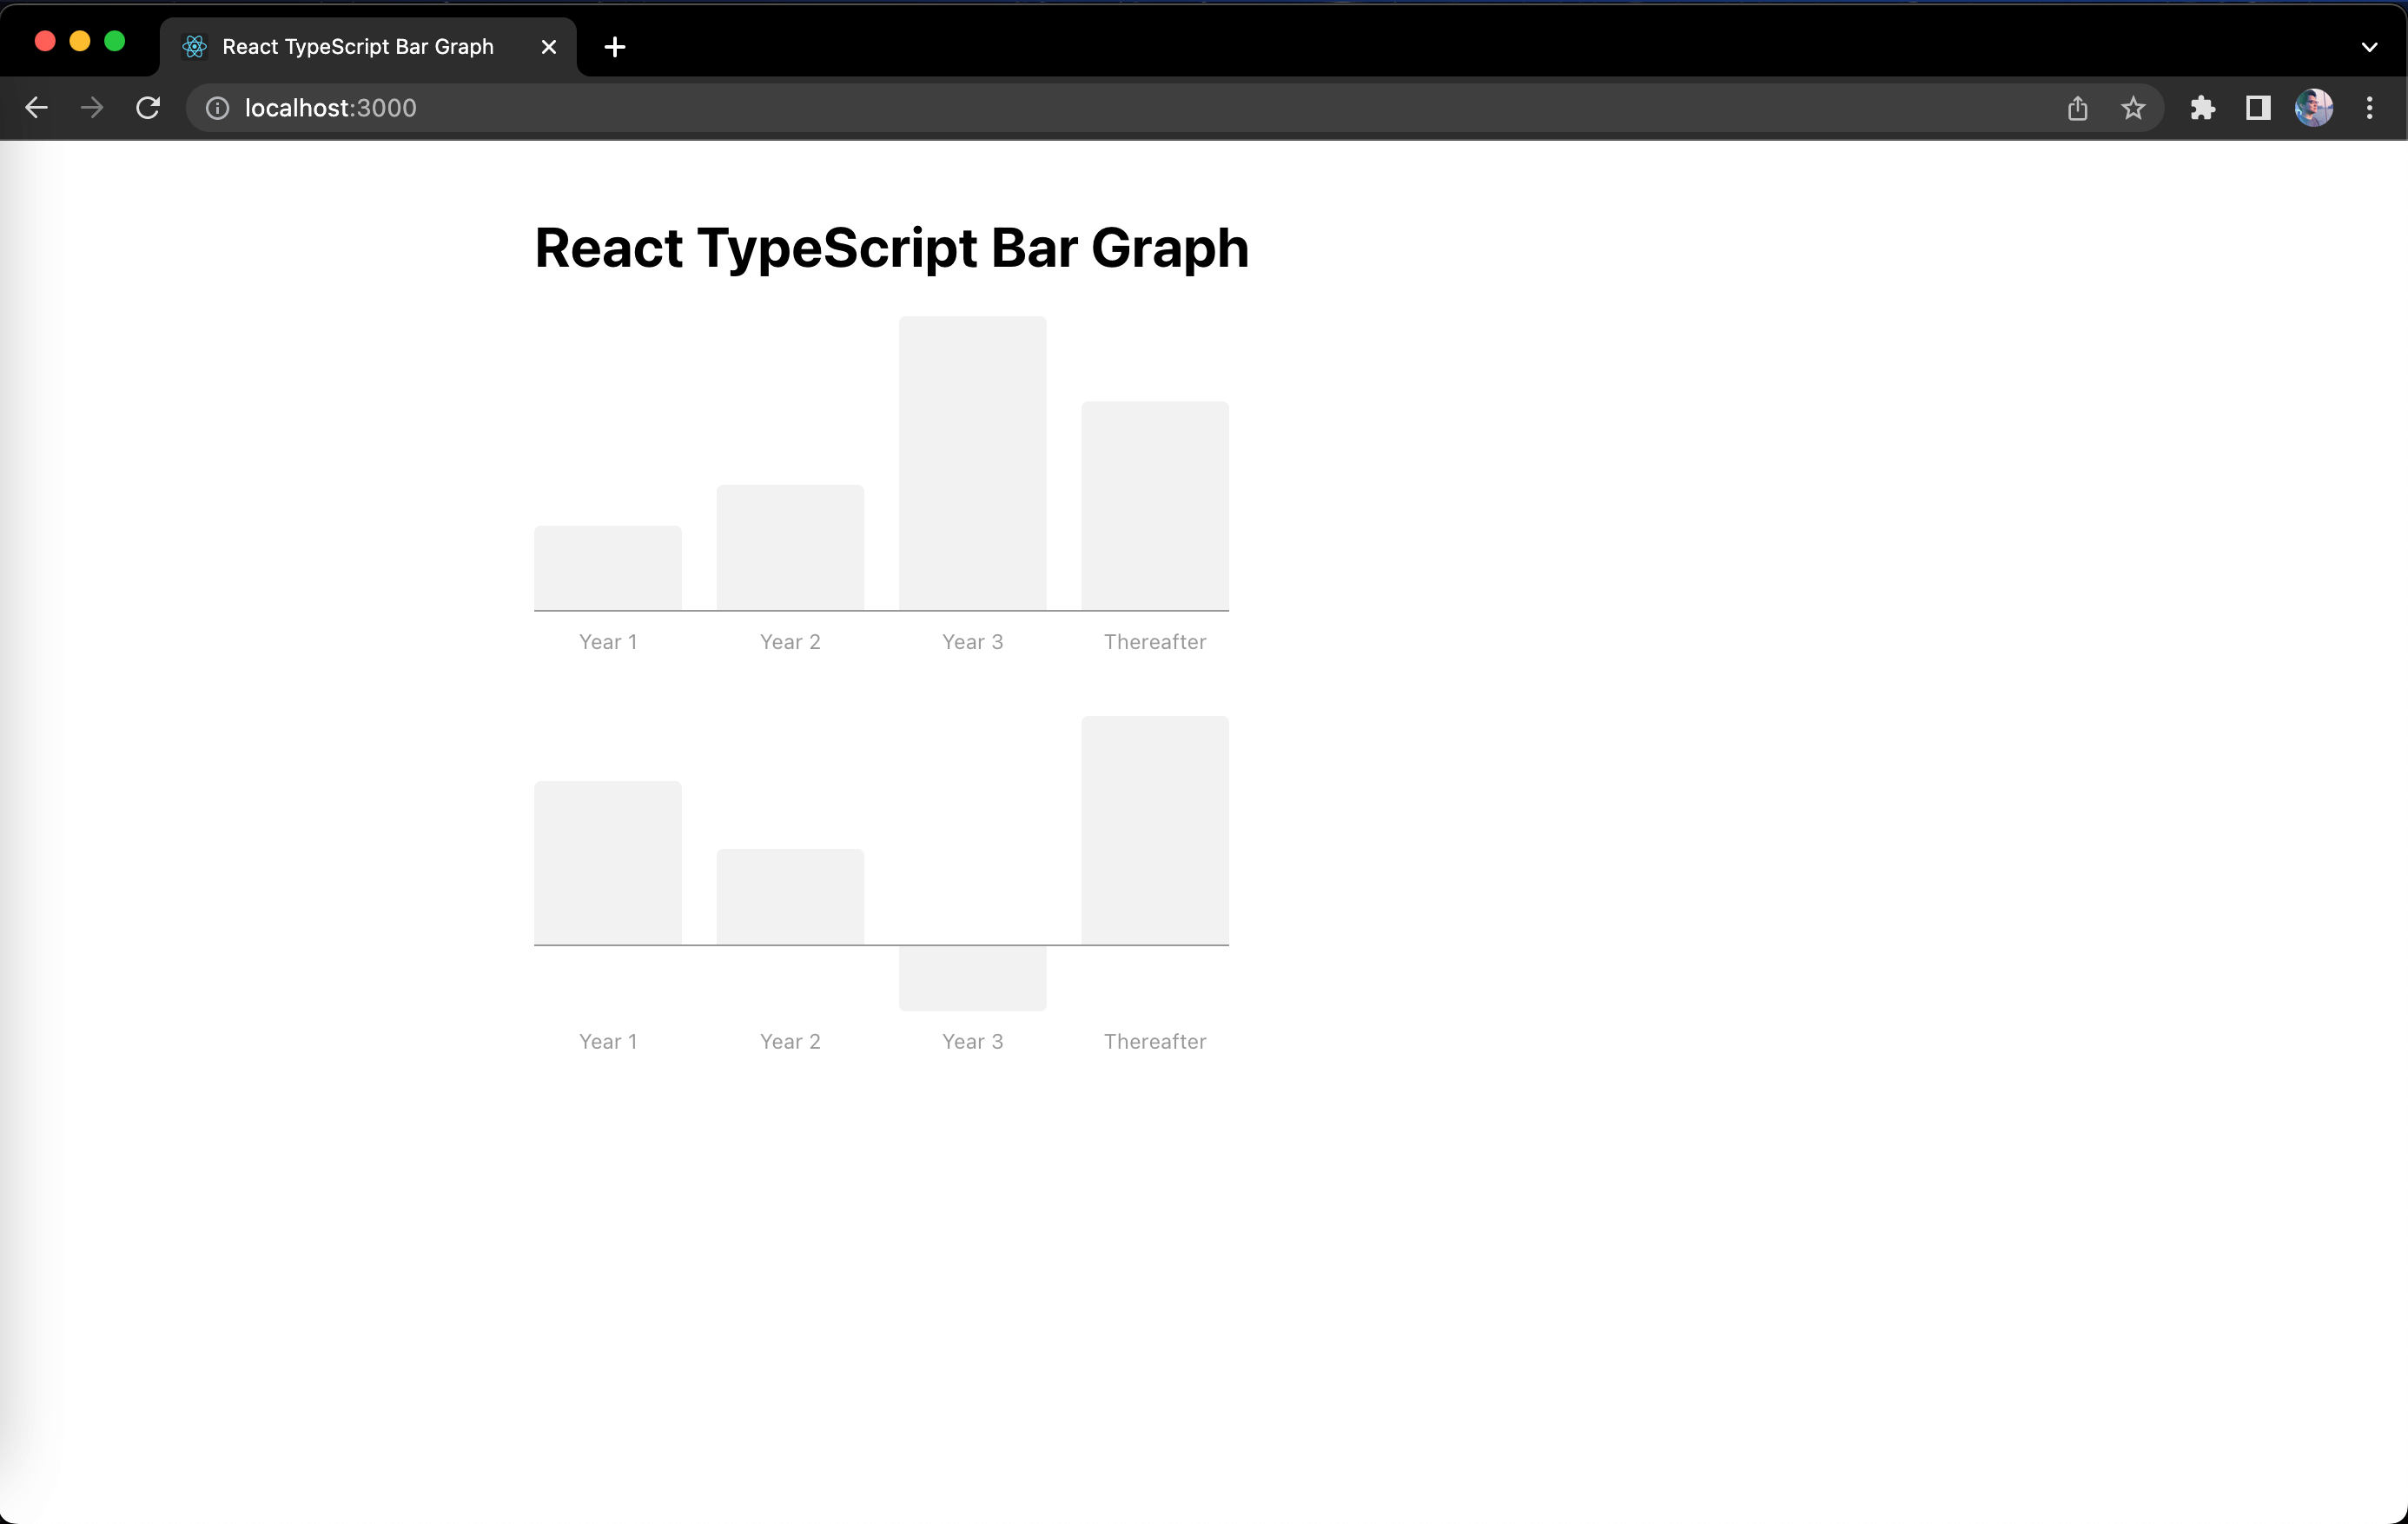
Don't worry! I'm here to help and guide you on how to solve this. As always, before we tackle any problems or complications, we can do some observations to help us understand the problem, collect all the data and eventually find a solution. First, let's observe the different instances below that we need to handle in our bar graph:
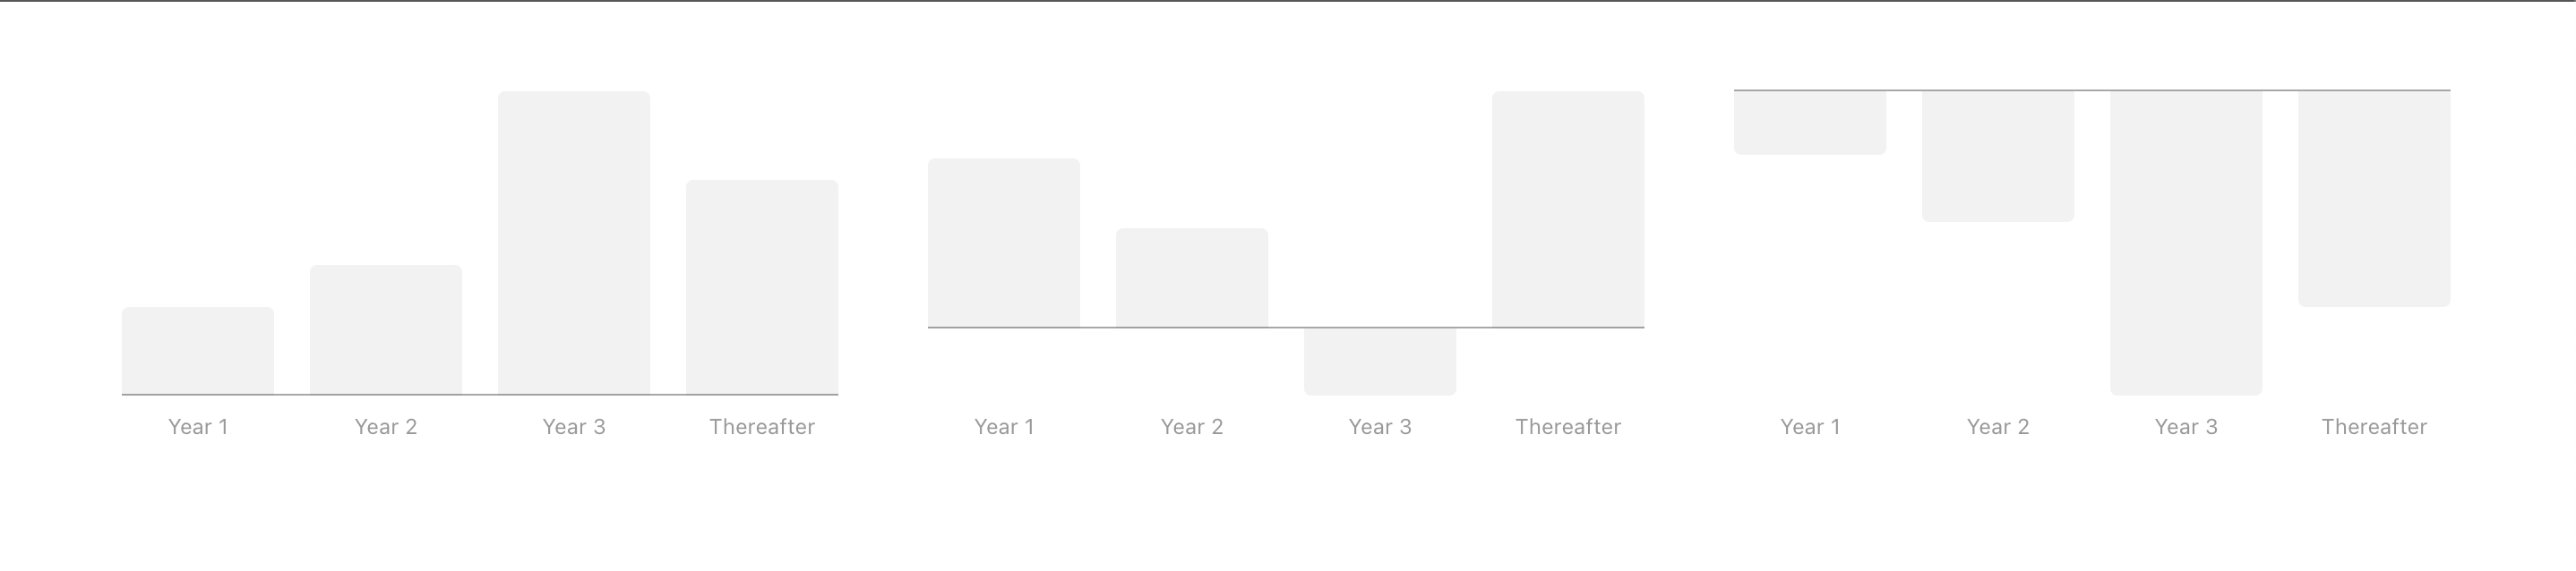
Starting from the left of the image or screenshot, the first graph displays a bar graph with all positive values, the line bar is at the bottom and one of the bars with the highest value occupies 100% of the graph height. The second graph displays a bar graph with one negative value, notice how the line bar elevates the same level as the bars with positive values. You could also say that the height of the bar with negative value is the same level as the line bar's elevation level. The third graph displays a bar graph with all negative values, aside from the line bar elevating, bars with smaller negative values also elevate until it sticks to the line bar.
Also from the observation, we can tell that all the graphs utilize 100% of the container height and the container height is static based on our CSS styles. In the first graph, the highest positive value becomes 100% and the rest of the bars will be based on that. In the second graph, the sum of the highest positive value and the highest negative value (by absolute) becomes 100% and the rest of the bars will be based on that. In the third graph, similarly to the first graph, the highest negative value (by absolute) becomes 100% and the rest of the bars will be based on that. I hope I explained it clearly enough, but if not, maybe the following steps will do.
Let's start with the actual values of the first graph. That would be 200, 300, 700 and 500. Our first step is to get the highest positive value among these values and that would be 700.
Once we get the highest positive value, we can divide each value with the highest positive value.
In order, it would be: 200 / 700, 300 / 700, 700 / 700 and 500 / 700. We will get: 0.29, 0.43, 1 and 0.71. To convert them into percentages, we just have to multiply them by 100 and we will get: 29%, 43%, 100%, and 71%.
I think this is a good start for us to update our React app code with this logic in mind, open src/App.tsx and update our App component to provide data to our bar graph with the following code:
...
export default function App() {
  const dataArray1 = [
    {
      value: 200,
      legend: 'Year 1',
    },
    {
      value: 300,
      legend: 'Year 2',
    },
    {
      value: 700,
      legend: 'Year 3',
    },
    {
      value: 500,
      legend: 'Thereafter',
    },
  ];

  return (
    <div className="container">
      <h1>React TypeScript Bar Graph</h1>
      <BarGraph dataArray={dataArray1} />
    </div>
  );
}
You will receive TypeScript errors when you save this change but they will be fixed once we complete the overall changes.
Next, let's open src/components/BarGraph.tsx and update our BarGraph component to convert the values from dataArray into percentages using the logic we discussed earlier so they can be represented accordingly in each of the bars:
import React, { useMemo } from 'react';
import BarItem from './BarItem';
import './BarGraph.css';

export type Props = {
  dataArray: Array<{
    value: number;
    legend: string;
  }>;
};

export default function BarGraph({ dataArray }: Props) {
  const barItems = useMemo(() => {
    let highestValue = 0;

    // get the highest value
    dataArray.forEach(({ value }) => {
      highestValue = Math.max(highestValue, value);
    });

    // calculate "barPercentage" using the "highestValue" to construct the bar items
    return dataArray.map((item) => ({
      legend: item.legend,
      barPercentage: `${Math.round((item.value / highestValue) * 100)}%`,
    }));
  }, [dataArray]);

  return (
    <div className="bar-graph">
      <div className="bars-list">
        {barItems.map((barItem, idx) => (
          <BarItem
            key={idx}
            legend={barItem.legend}
            barPercentage={barItem.barPercentage}
          />
        ))}
      </div>
      <div className="bars-line" />
    </div>
  );
}
In the code above, we created the type Props for the required props of the BarGraph component. If you're new to TypeScript, this is how we define a type for an array of values. You might wonder why it's not defined like this:
export type Props = {
  dataArray: [{ value: number; legend: string }];
};
This is actually accepted in TypeScript as well, but this type means that it requires the prop dataArray to be an array with one object only. It will not accept less than or more than one object. Hence we are using the Array interface to represent the type for dataArray props can accept an array of items with any length.
Also in the code above, we use React.useMemo() to convert the values into percentages and construct the barItems array that we can loop to render each BarItem component and pass the required props. React.useMemo() returns a memoized value which also means that it will only recompute the memoized value when one of the dependencies has changed, in this case is the dataArray we got from the props of the BarGraph component. This makes our bar graph reactive!
Finally, let's update src/components/BarItem.tsx to support the new prop barPercentage and use that to set the height of the bar in the BarItem component:
...
export type Props = {
  legend: string;
  barPercentage: string;
};

export default function BarItem(props: Props) {
  return (
    <div className="bar-item" style={{ height: props.barPercentage }}>
      <div className="bar-item-legend">{props.legend}</div>
    </div>
  );
}
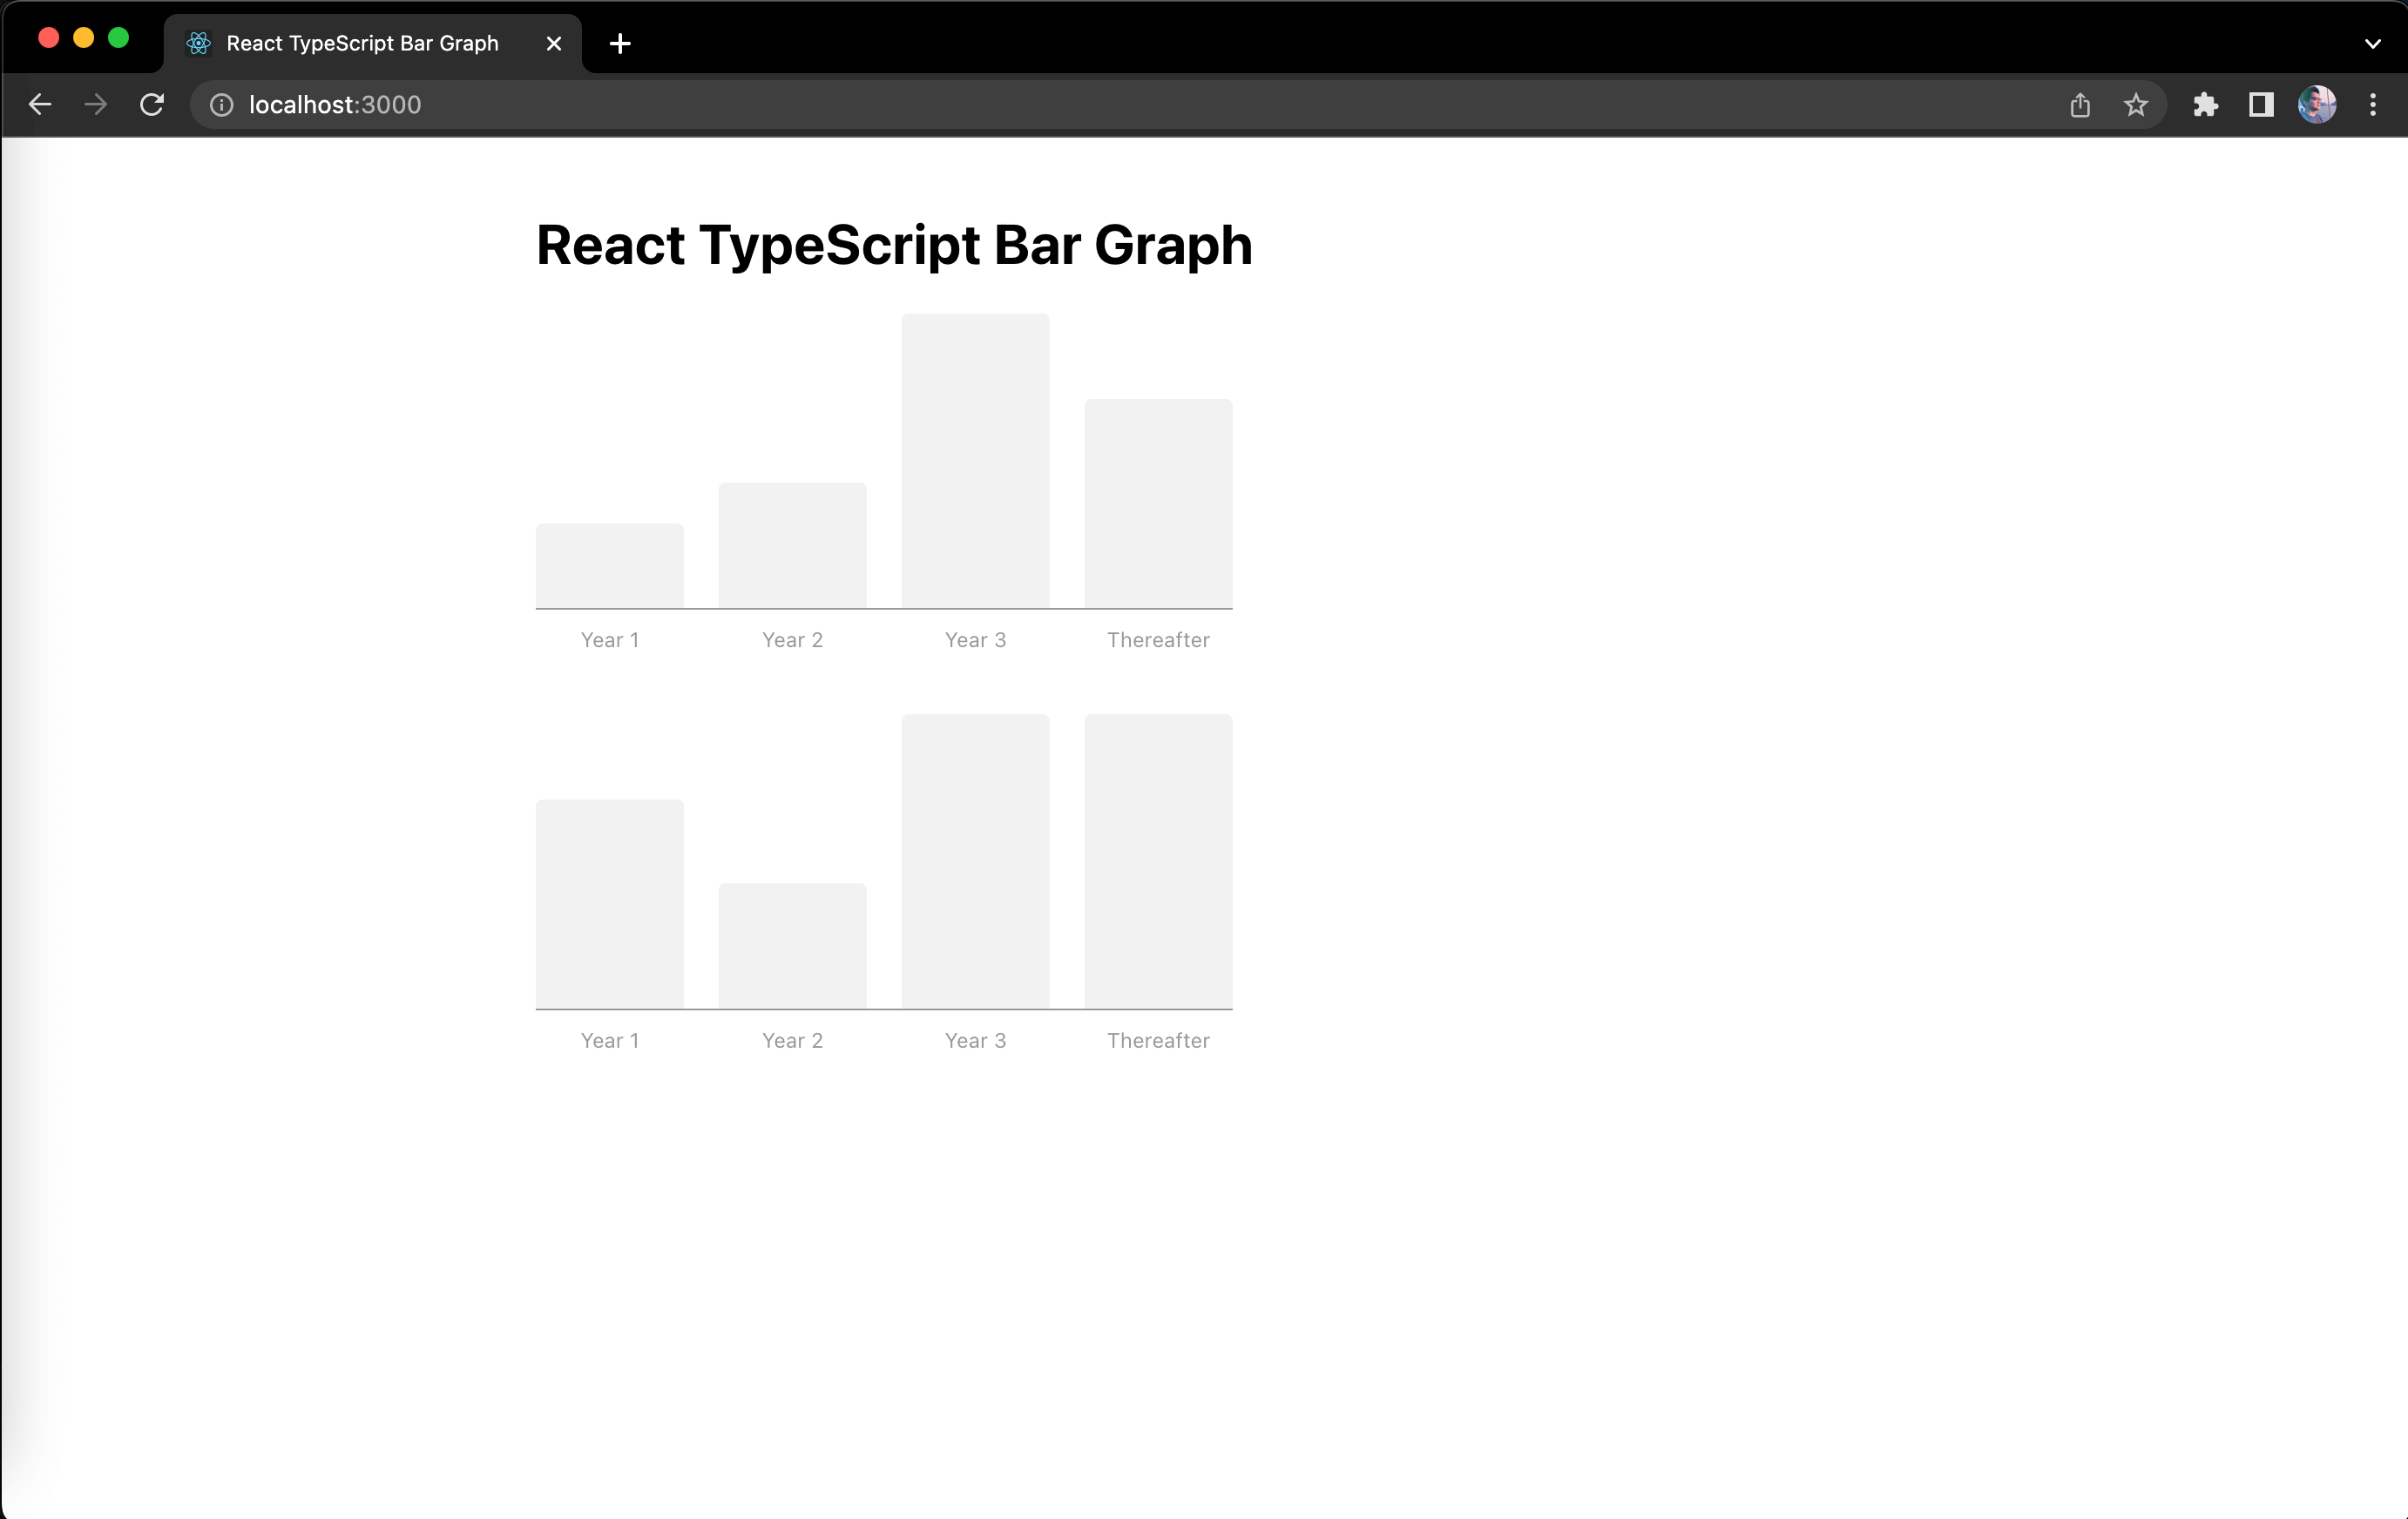
Alright. Once all the changes are saved, you should see something like this in your React application:
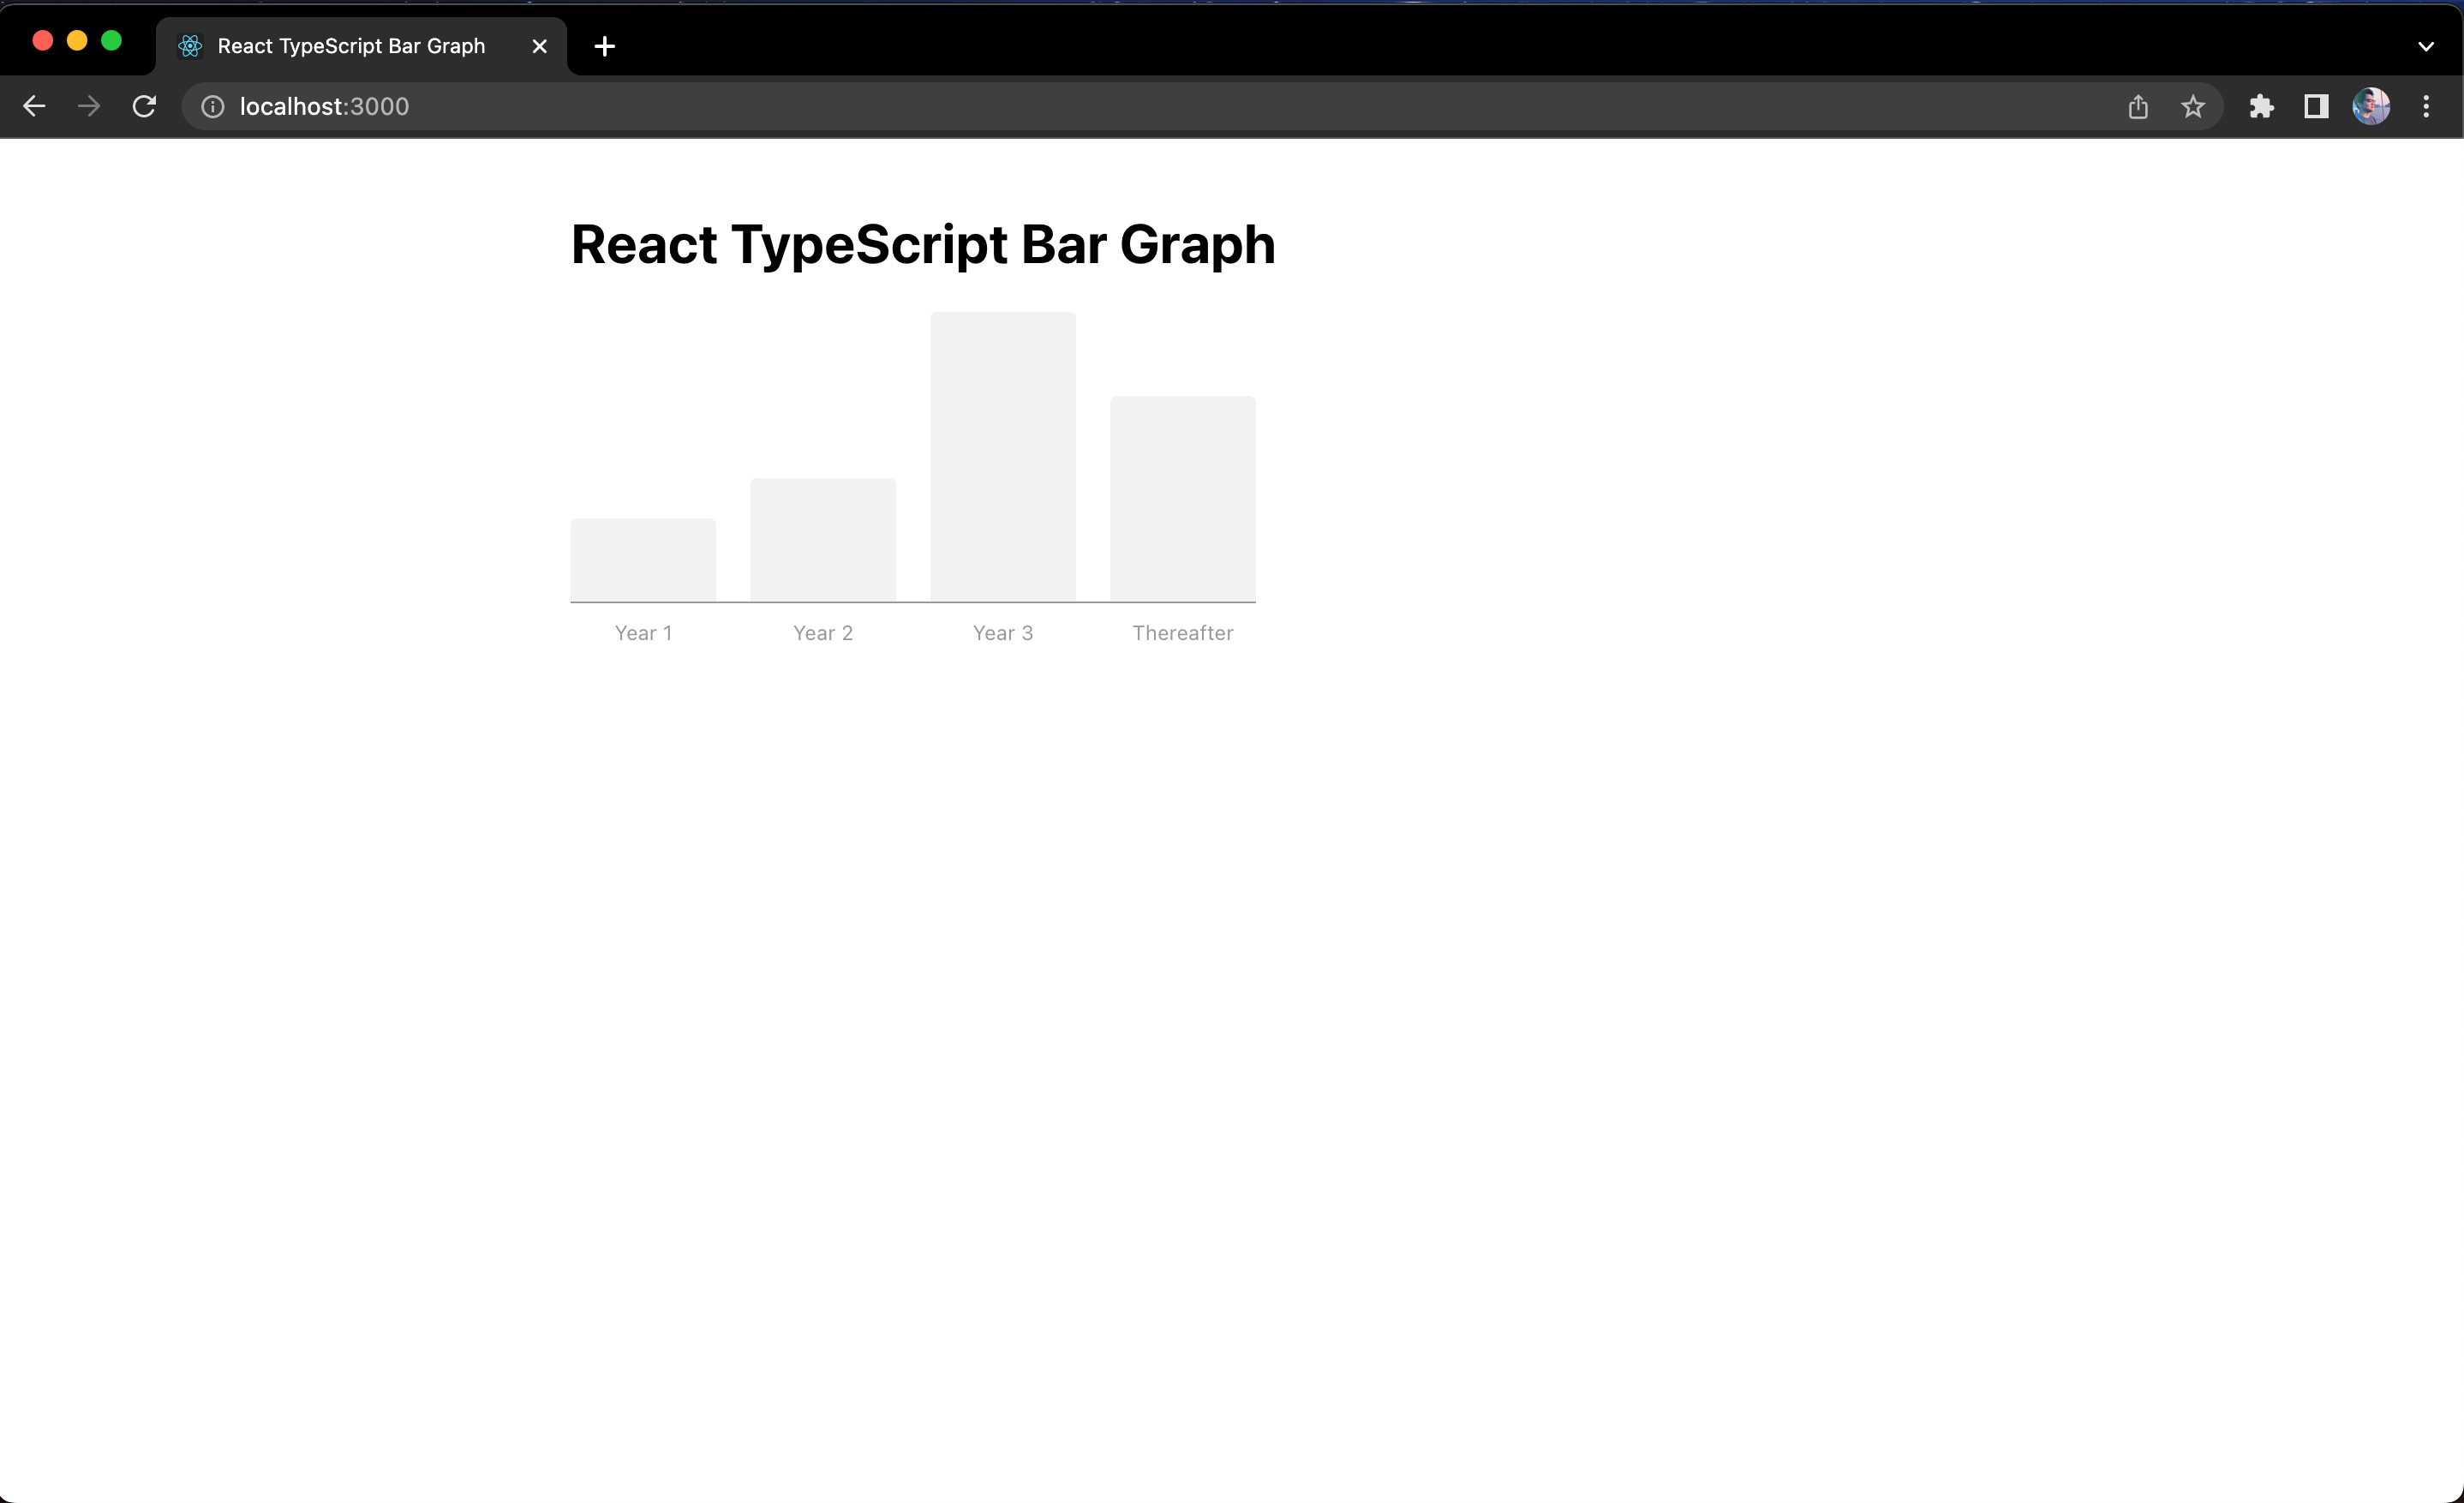
Great! We can see our bar graph displaying the bars with different heights which is a percentile representation of the values we passed from the App component. This is exactly the same as the first graph that displays the bars with all positive values.
Display bars with negative values (Part 1)
With our current logic, what happens if we have a negative value in the dataArray? Let's find out by updating our App component in src/App.tsx and see what happens. Here are the values for the expected second graph:
...
export default function App() {
  const dataArray1 = [
    ...
  ];
  const dataArray2 = [
    {
      value: 500,
      legend: 'Year 1',
    },
    {
      value: 300,
      legend: 'Year 2',
    },
    {
      value: -200,
      legend: 'Year 3',
    },
    {
      value: 700,
      legend: 'Thereafter',
    },
  ];

  return (
    <div className="container">
      <h1>React TypeScript Bar Graph</h1>
      <BarGraph dataArray={dataArray1} />
      <BarGraph dataArray={dataArray2} />
    </div>
  );
}
Before we look into our React app, let's update the style in src/components/BarGraph.css to give some space between the bar graphs:
.bar-graph {
  ...
  margin-bottom: 60px;
}
...
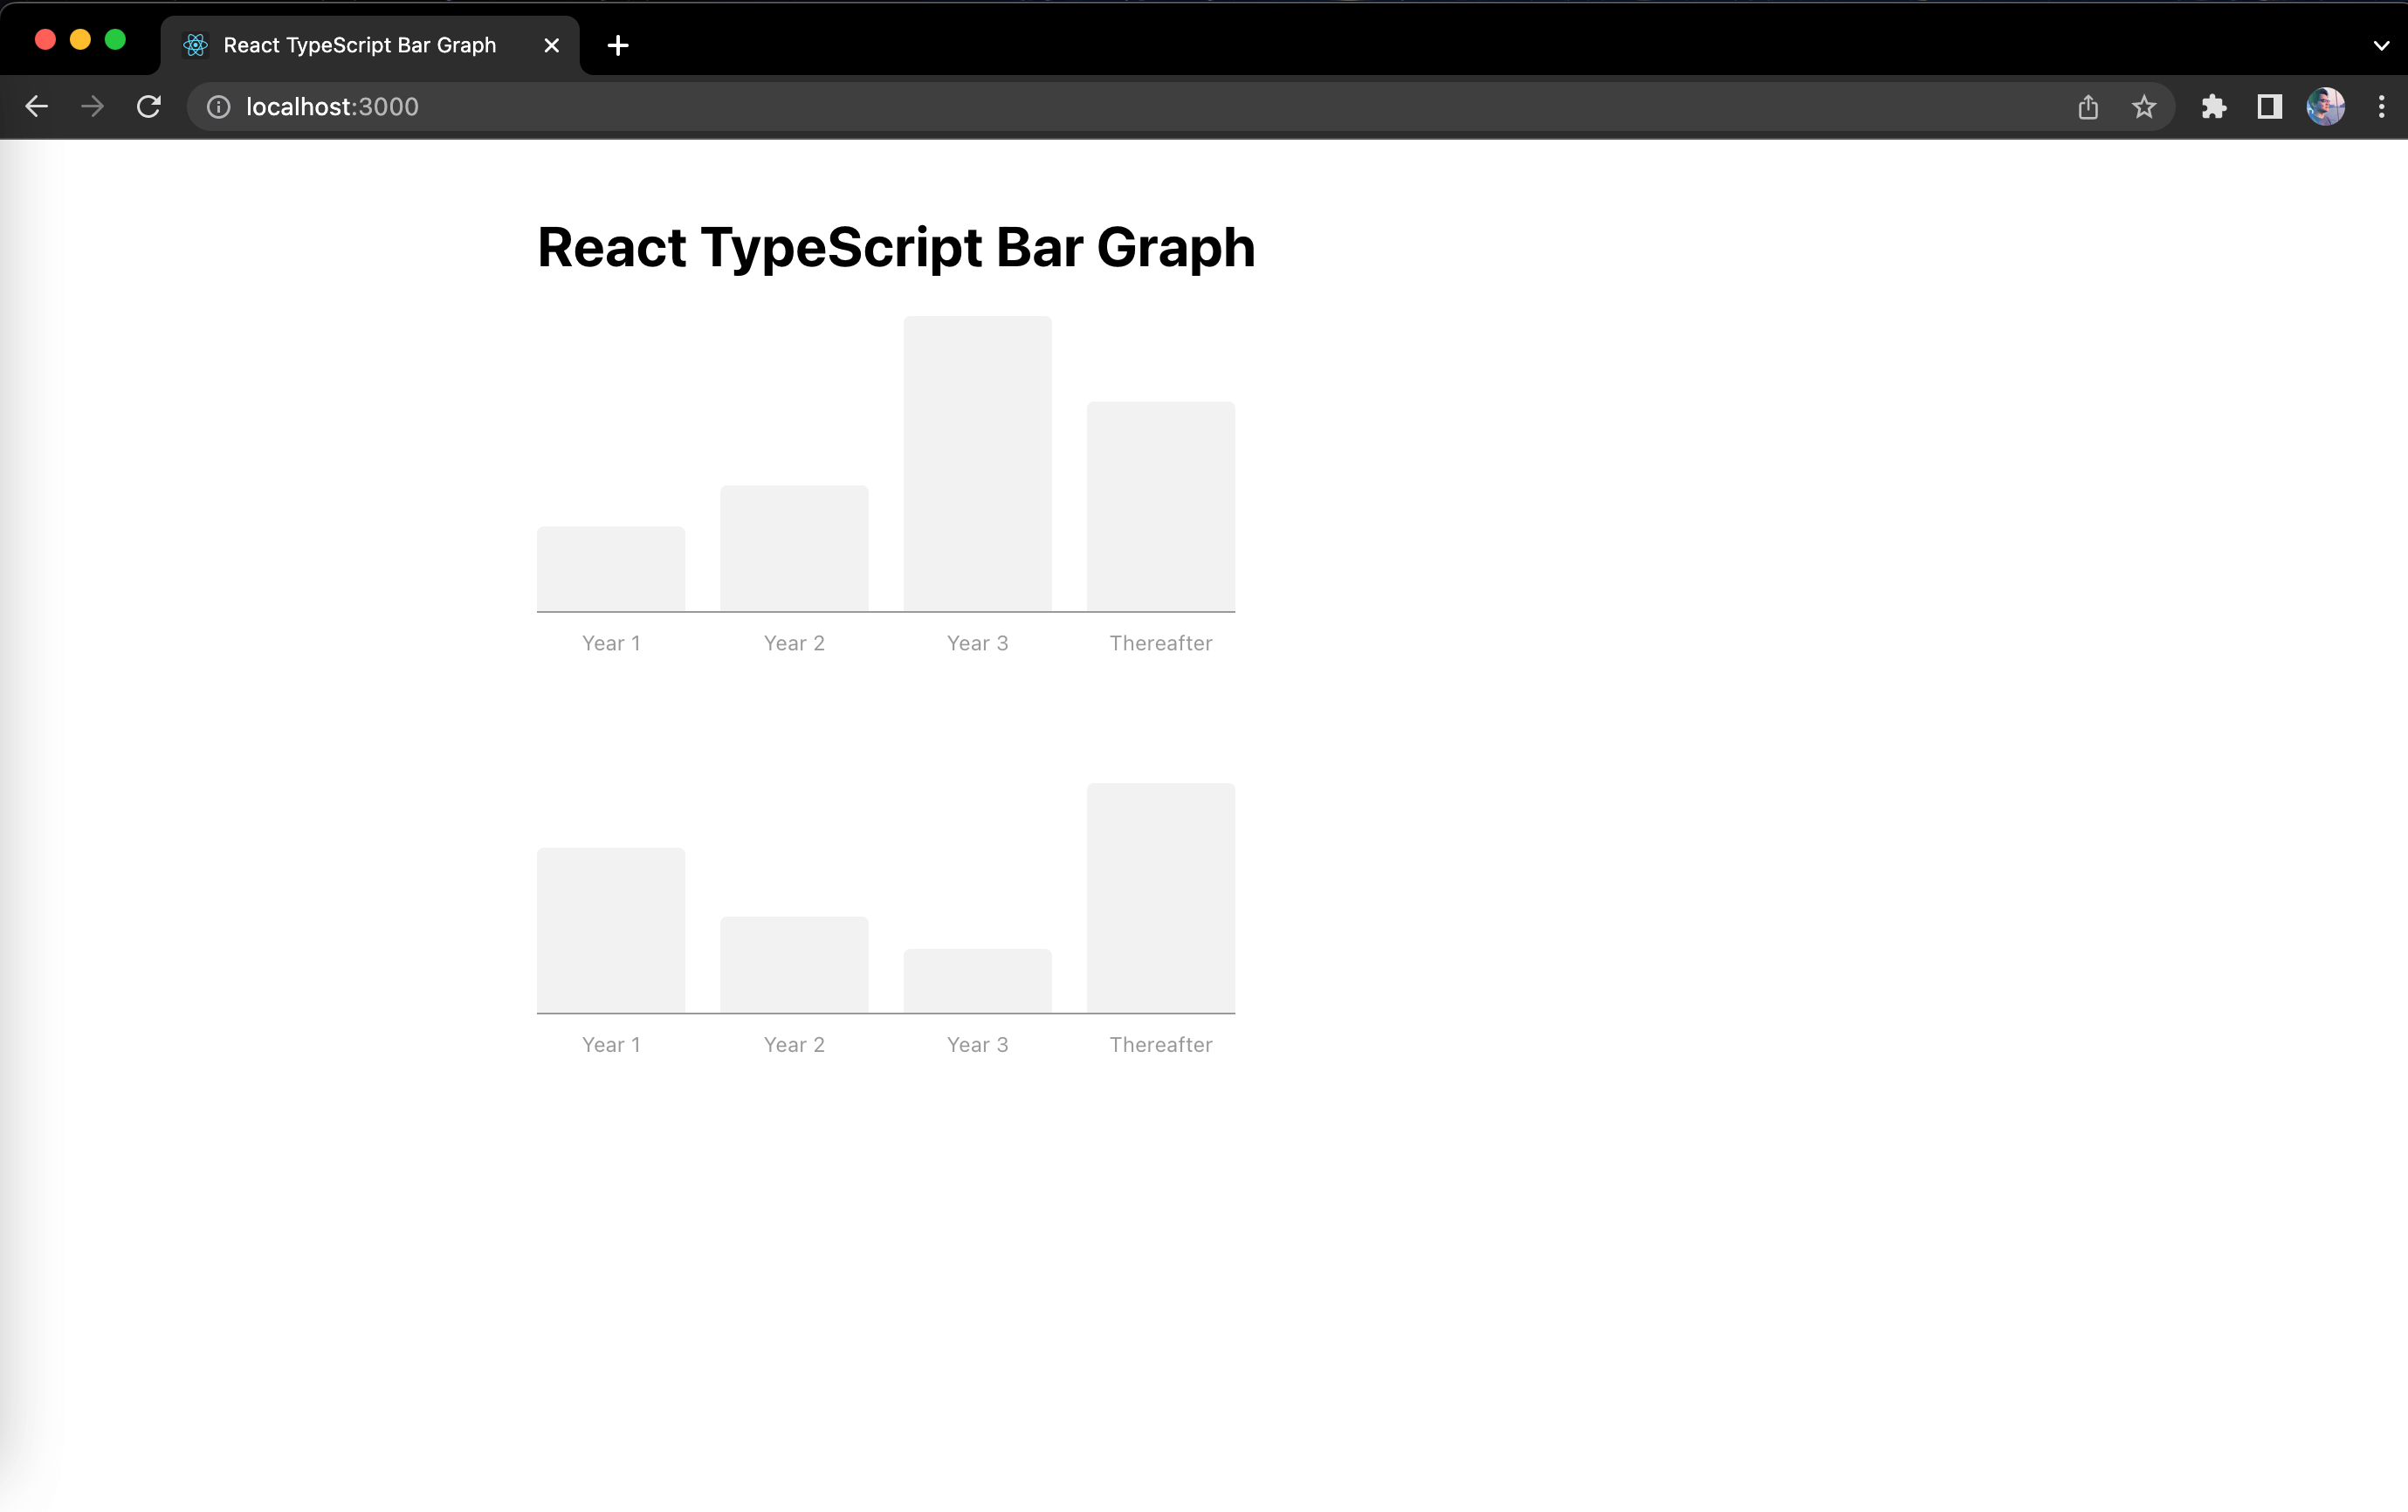
Alright, now let's see what is displayed in our React app:
Not quite what we expected because our current logic doesn't handle negative values properly yet.
Let us recall the observation we had for the expected second graph. The sum of the highest positive value and the highest negative value (by absolute) becomes 100% and the rest of the bars will be based on that. We already know how to get the highest value, now we just need to check if the value is positive or negative, and store them separately depending on the number sign. Let's do that first and update our BarGraph component in src/components/BarGraph.tsx:
...
export default function BarGraph({ dataArray }: Props) {
  const barItems = useMemo(() => {
    let highestValuePositive = 0;
    let highestValueNegative = 0;

    dataArray.forEach(({ value }) => {
      if (value > 0) {
        highestValuePositive = Math.max(highestValuePositive, value);
      } else {
        // use Math.abs() to convert the values from negative to positive
        // when storing them as "highestValueNegative"
        highestValueNegative = Math.max(highestValueNegative, Math.abs(value));
      }
    });

    // use the sum of "highestValuePositive" and
    // "highestValueNegative" as the 100%
    const highestValueTotal = highestValuePositive + highestValueNegative;

    return dataArray.map((item) => ({
      legend: item.legend,
      barPercentage: `${Math.round(
        (Math.abs(item.value) / highestValueTotal) * 100
      )}%`,
    }));
  }, [dataArray]);

  return (
    ...
  );
}
Once we save the changes, let's take a look at our second graph now:
Alright! We've implemented the logic of converting the negative values to its proper percentage. For our next step, let's elevate the line bar. From our observation earlier, it was mentioned that the height of the bar with negative value is the same level as the line bar's elevation level. This means that we can use the highestValueNegative to determine how many percent the line bar would elevate. You might ask, how do we elevate the line bar? We can use the bottom CSS property for that as it supports percentage value as well. Let's update our BarGraph component once again in src/components/BarGraph.tsx:
...
export default function BarGraph({ dataArray }: Props) {
  const [barItems, barsLinePercentage] = useMemo(() => {
    ...

    const highestValueTotal = highestValuePositive + highestValueNegative;
    const barsLinePercent = Math.round(
      (highestValueNegative / highestValueTotal) * 100
    );
    const barItems = dataArray.map((item) => ({
      legend: item.legend,
      barPercentage: `${Math.round(
        (Math.abs(item.value) / highestValueTotal) * 100
      )}%`,
    }));

    return [barItems, `${barsLinePercent}%`];
  }, [dataArray]);

  return (
    <div className="bar-graph">
      <div className="bars-list">
        ...
      </div>
      <div className="bars-line" style={{ bottom: barsLinePercentage }} />
    </div>
  );
}
Once you save the changes, you should see something like this:
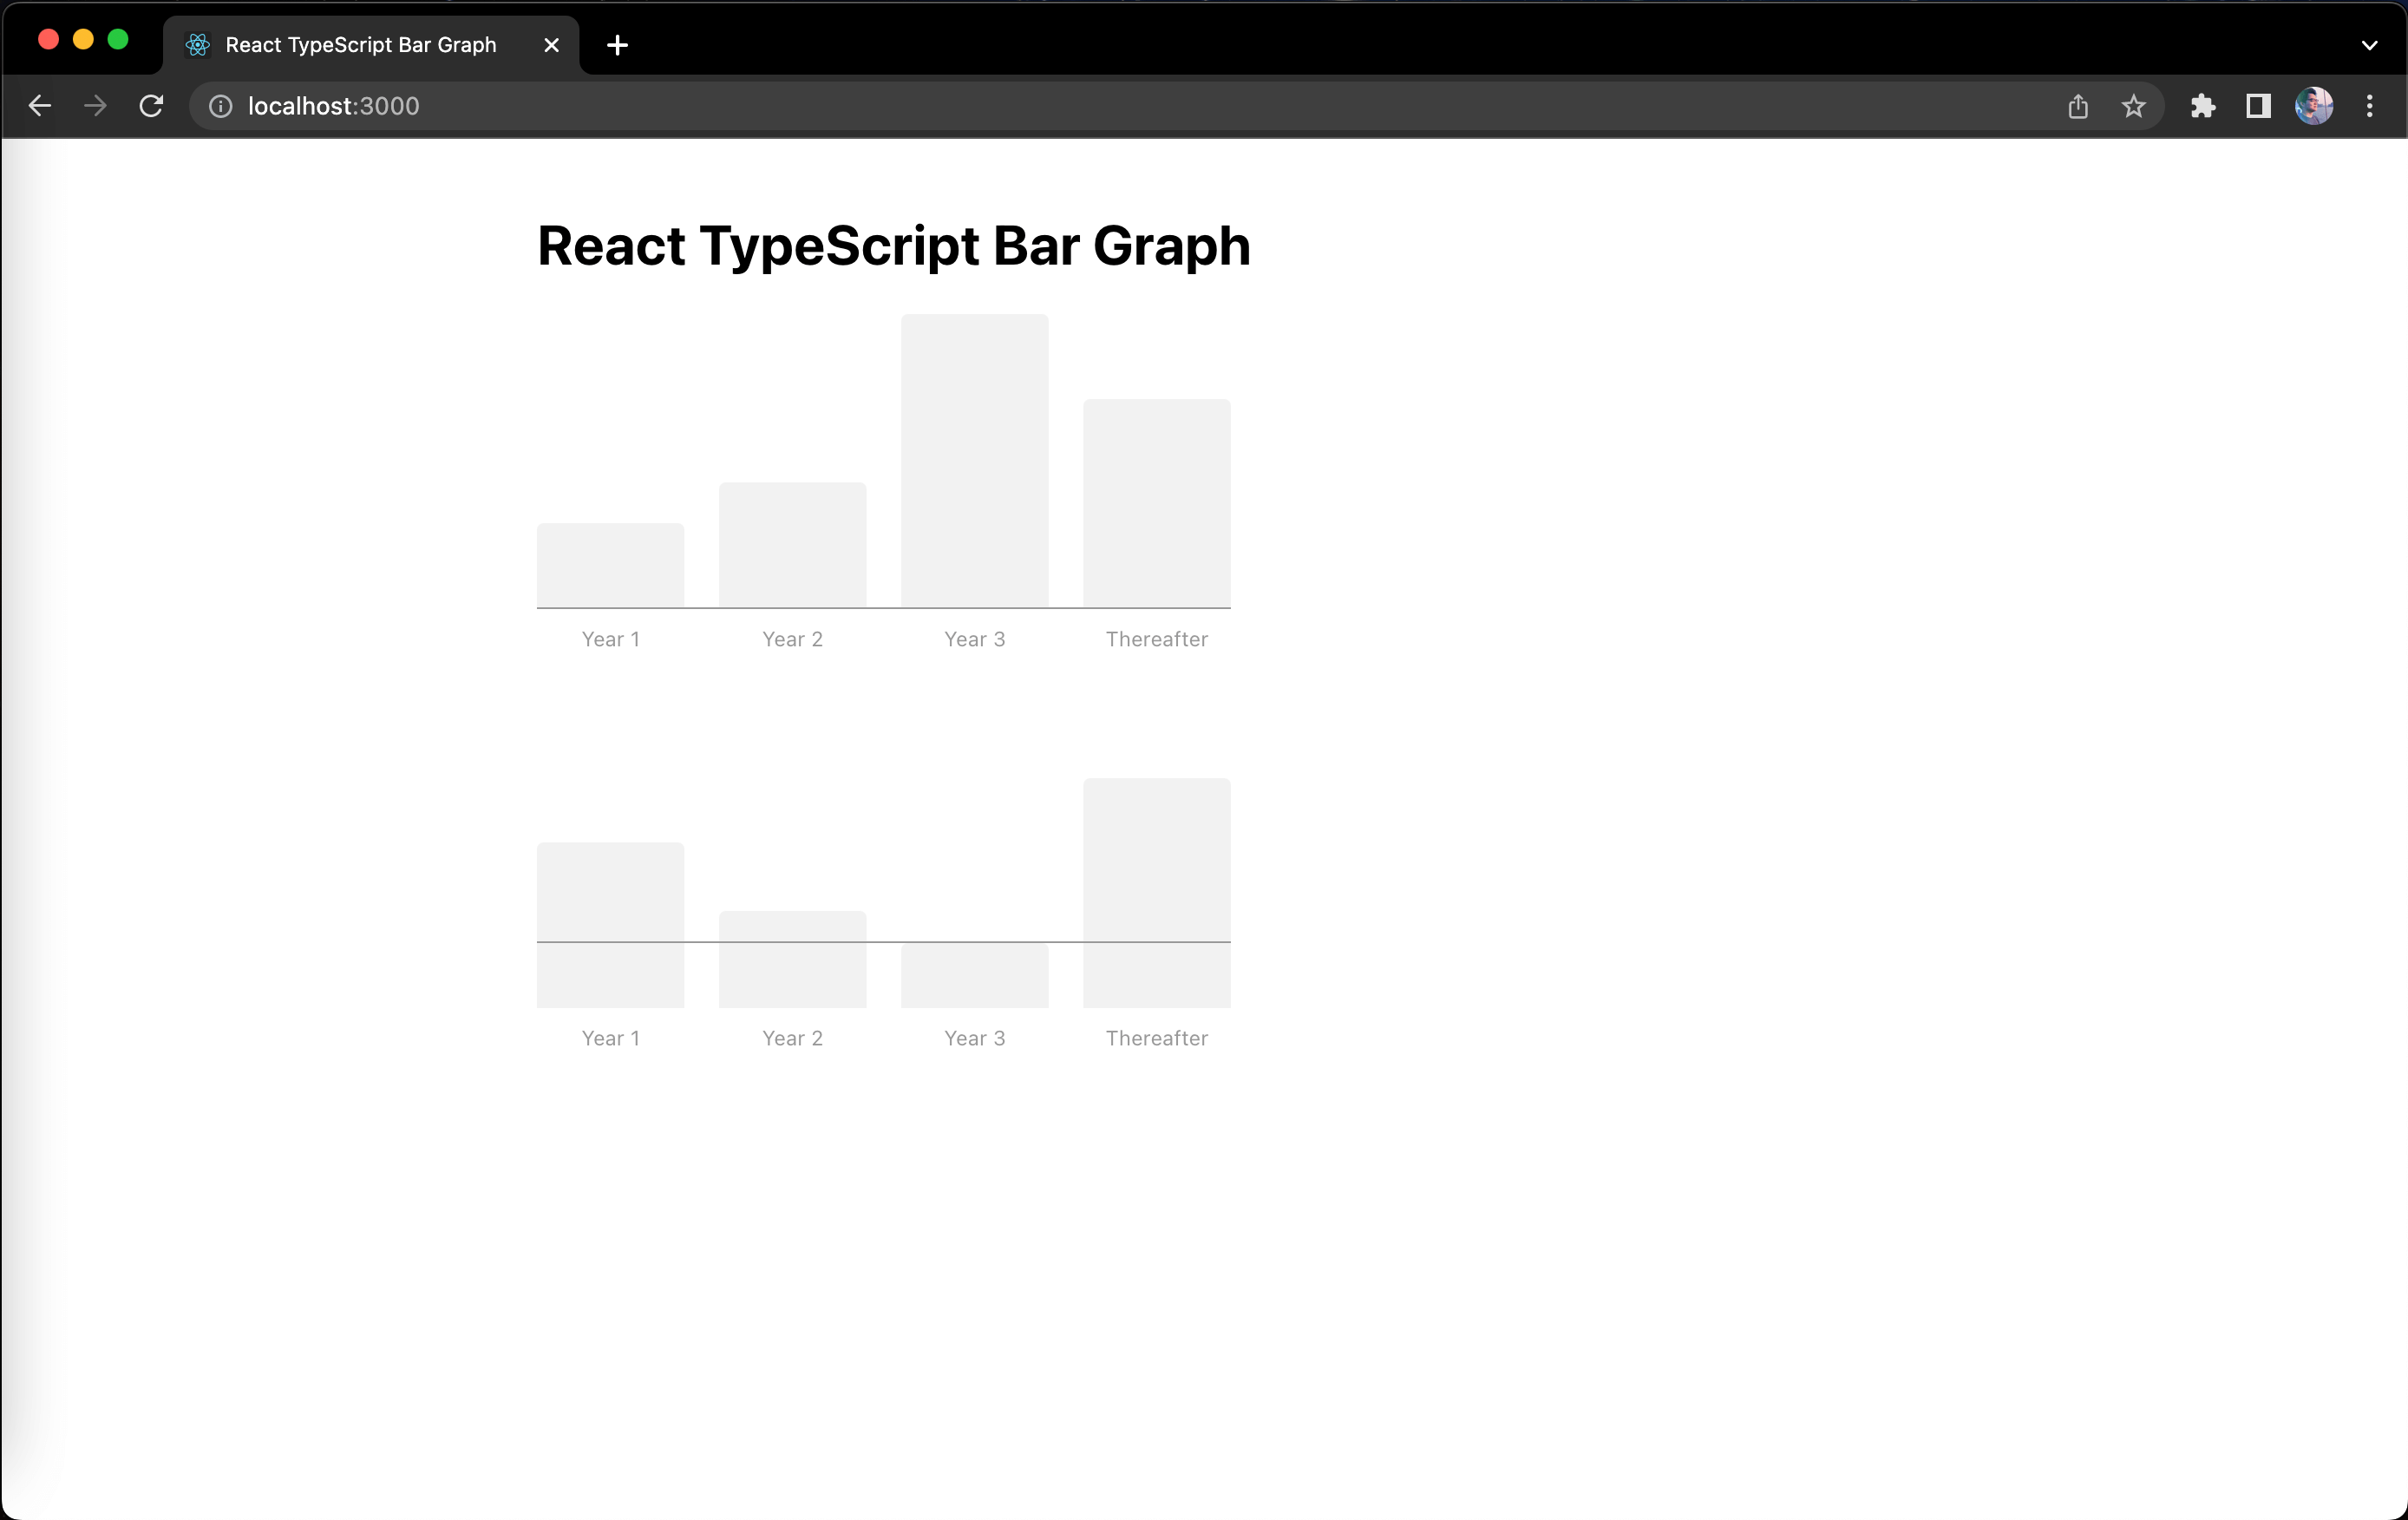
Alright, our line bar has elevated and that's where we expect it to be. You can already tell what our next step is going to be, we need to elevate the bars with positive values the same level as our line bar. To do that, we'll need to pass a new prop to our BarItem component with the percentage value of the elevation, let's call this prop as the risePercentage. Here's the change we need for BarGraph component in src/components/BarGraph.tsx:
...
export default function BarGraph({ dataArray }: Props) {
  const [barItems, barsLinePercentage] = useMemo(() => {
    ...
    const barsLinePercent = Math.round(
      (highestValueNegative / highestValueTotal) * 100
    );
    const barsLinePercentage = `${barsLinePercent}%`;
    const barItems = dataArray.map(({ legend, value }) => ({
      legend,
      barPercentage: `${Math.round(
        (Math.abs(value) / highestValueTotal) * 100
      )}%`,

      // if "value" is negative, let's put `0` for now which means no elevation needed
      risePercentage: value > 0 ? barsLinePercentage : '0',
    }));

    return [barItems, barsLinePercentage];
  }, [dataArray]);

  return (
    <div className="bar-graph">
      <div className="bars-list">
        {barItems.map((barItem, idx) => (
          <BarItem
            ...
            risePercentage={barItem.risePercentage}
          />
        ))}
      </div>
      <div className="bars-line" style={{ bottom: barsLinePercentage }} />
    </div>
  );
}
Next, we will need to support the new prop risePercentage in our BarItem component. Let's go ahead and update the code in src/components/BarItem.tsx:
...
export type Props = {
  ...
  risePercentage: string;
};

export default function BarItem(props: Props) {
  return (
    <div className="bar-item">
      <div
        className="bar-item-main"
        style={{ height: props.barPercentage }}
      />
      <div
        className="bar-item-offset"
        style={{ height: props.risePercentage }}
      />
      <div className="bar-item-legend">{props.legend}</div>
    </div>
  );
}
So in the changes above, we modified the structure of the HTML and created two new div elements inside the .bar-item element. The .bar-item-main element will be the actual bar and the .bar-item-offset will be the one to elevate or raise the actual bar. By making the .bar-item element a flexbox container and setting the flex-direction value as column, this will work as expected. Let's update the styles for the BarItem component in src/components/BarItem.css:
.bar-item {
  position: relative;
  flex: 1;
  display: flex;
  flex-direction: column;
  justify-content: flex-end;
  height: 100%;
}

.bar-item-main {
  width: 100%;
  background-color: #f2f2f2;
  border-top-right-radius: 4px;
  border-top-left-radius: 4px;
}

.bar-item:hover .bar-item-main {
  background-color: #54d6da;
}
...
Okay, save the changes and let's see how our second graph is looking now:
Sweet! To complete the changes for our second graph, let's make bars with negative values to actually face downwards by applying the border radius on the bottom instead of the top and also changing the background color on hover.
Let's have a prop that is passed down to the BarItem component to determine if it has a negative value. Go to src/components/BarGraph.tsx and update the code with the following below:
...
export default function BarGraph({ dataArray }: Props) {
  const [barItems, barsLinePercentage] = useMemo(() => {
    ...
    const barItems = dataArray.map(({ legend, value }) => {
      const isNegative = value < 0;

      return {
        legend,
        isNegative,
        barPercentage: `${Math.round(
          (Math.abs(value) / highestValueTotal) * 100
        )}%`,
        risePercentage: isNegative ? '0' : barsLinePercentage,
      };
    });

    return [barItems, barsLinePercentage];
  }, [dataArray]);

  return (
    <div className="bar-graph">
      <div className="bars-list">
        {barItems.map((barItem, idx) => (
          <BarItem
            ...
            isNegative={barItem.isNegative}
          />
        ))}
      </div>
      <div className="bars-line" style={{ bottom: barsLinePercentage }} />
    </div>
  );
}
Then, let's go to src/components/BarItem.tsx and support this new prop isNegative:
import React from 'react';
import cn from 'classnames';
import './BarItem.css';

export type Props = {
  ...
  isNegative: boolean;
};

export default function BarItem(props: Props) {
  return (
    <div className={cn('bar-item', { 'is-negative': props.isNegative })}>
      ...
    </div>
  );
}
In the changes above, we're using the classnames library we installed earlier. The classnames function can accept an object of keys with boolean values. If the value of the key is true, then that key will be added as a part of the className string. So if the props.isNegative is true, the className value would be "bar-item is-negative", but if it's false, then the className value would only be "bar-item".
Finally, let's update the styles in src/components/BarItem.css to support the is-negative class:
...
.bar-item:hover .bar-item-main {
  ...
}

.bar-item.is-negative .bar-item-main {
  border-radius: 0 0 4px 4px;
}

.bar-item.is-negative:hover .bar-item-main {
  background-color: #ff9869;
}
...
After saving the changes above, here's the final look for our second graph:
Display bars with negative values (Part 2)
Nice! We're down to the last graph we need to handle. Let's first define the values for the third graph in our App component in src/App.tsx to see how our current logic will display all the bars with negative values:
...
export default function App() {
  ...
  const dataArray3 = [
    {
      value: -150,
      legend: 'Year 1',
    },
    {
      value: -300,
      legend: 'Year 2',
    },
    {
      value: -700,
      legend: 'Year 3',
    },
    {
      value: -500,
      legend: 'Thereafter',
    },
  ];

  return (
    <div className="container">
      ...
      <BarGraph dataArray={dataArray3} />
    </div>
  );
}
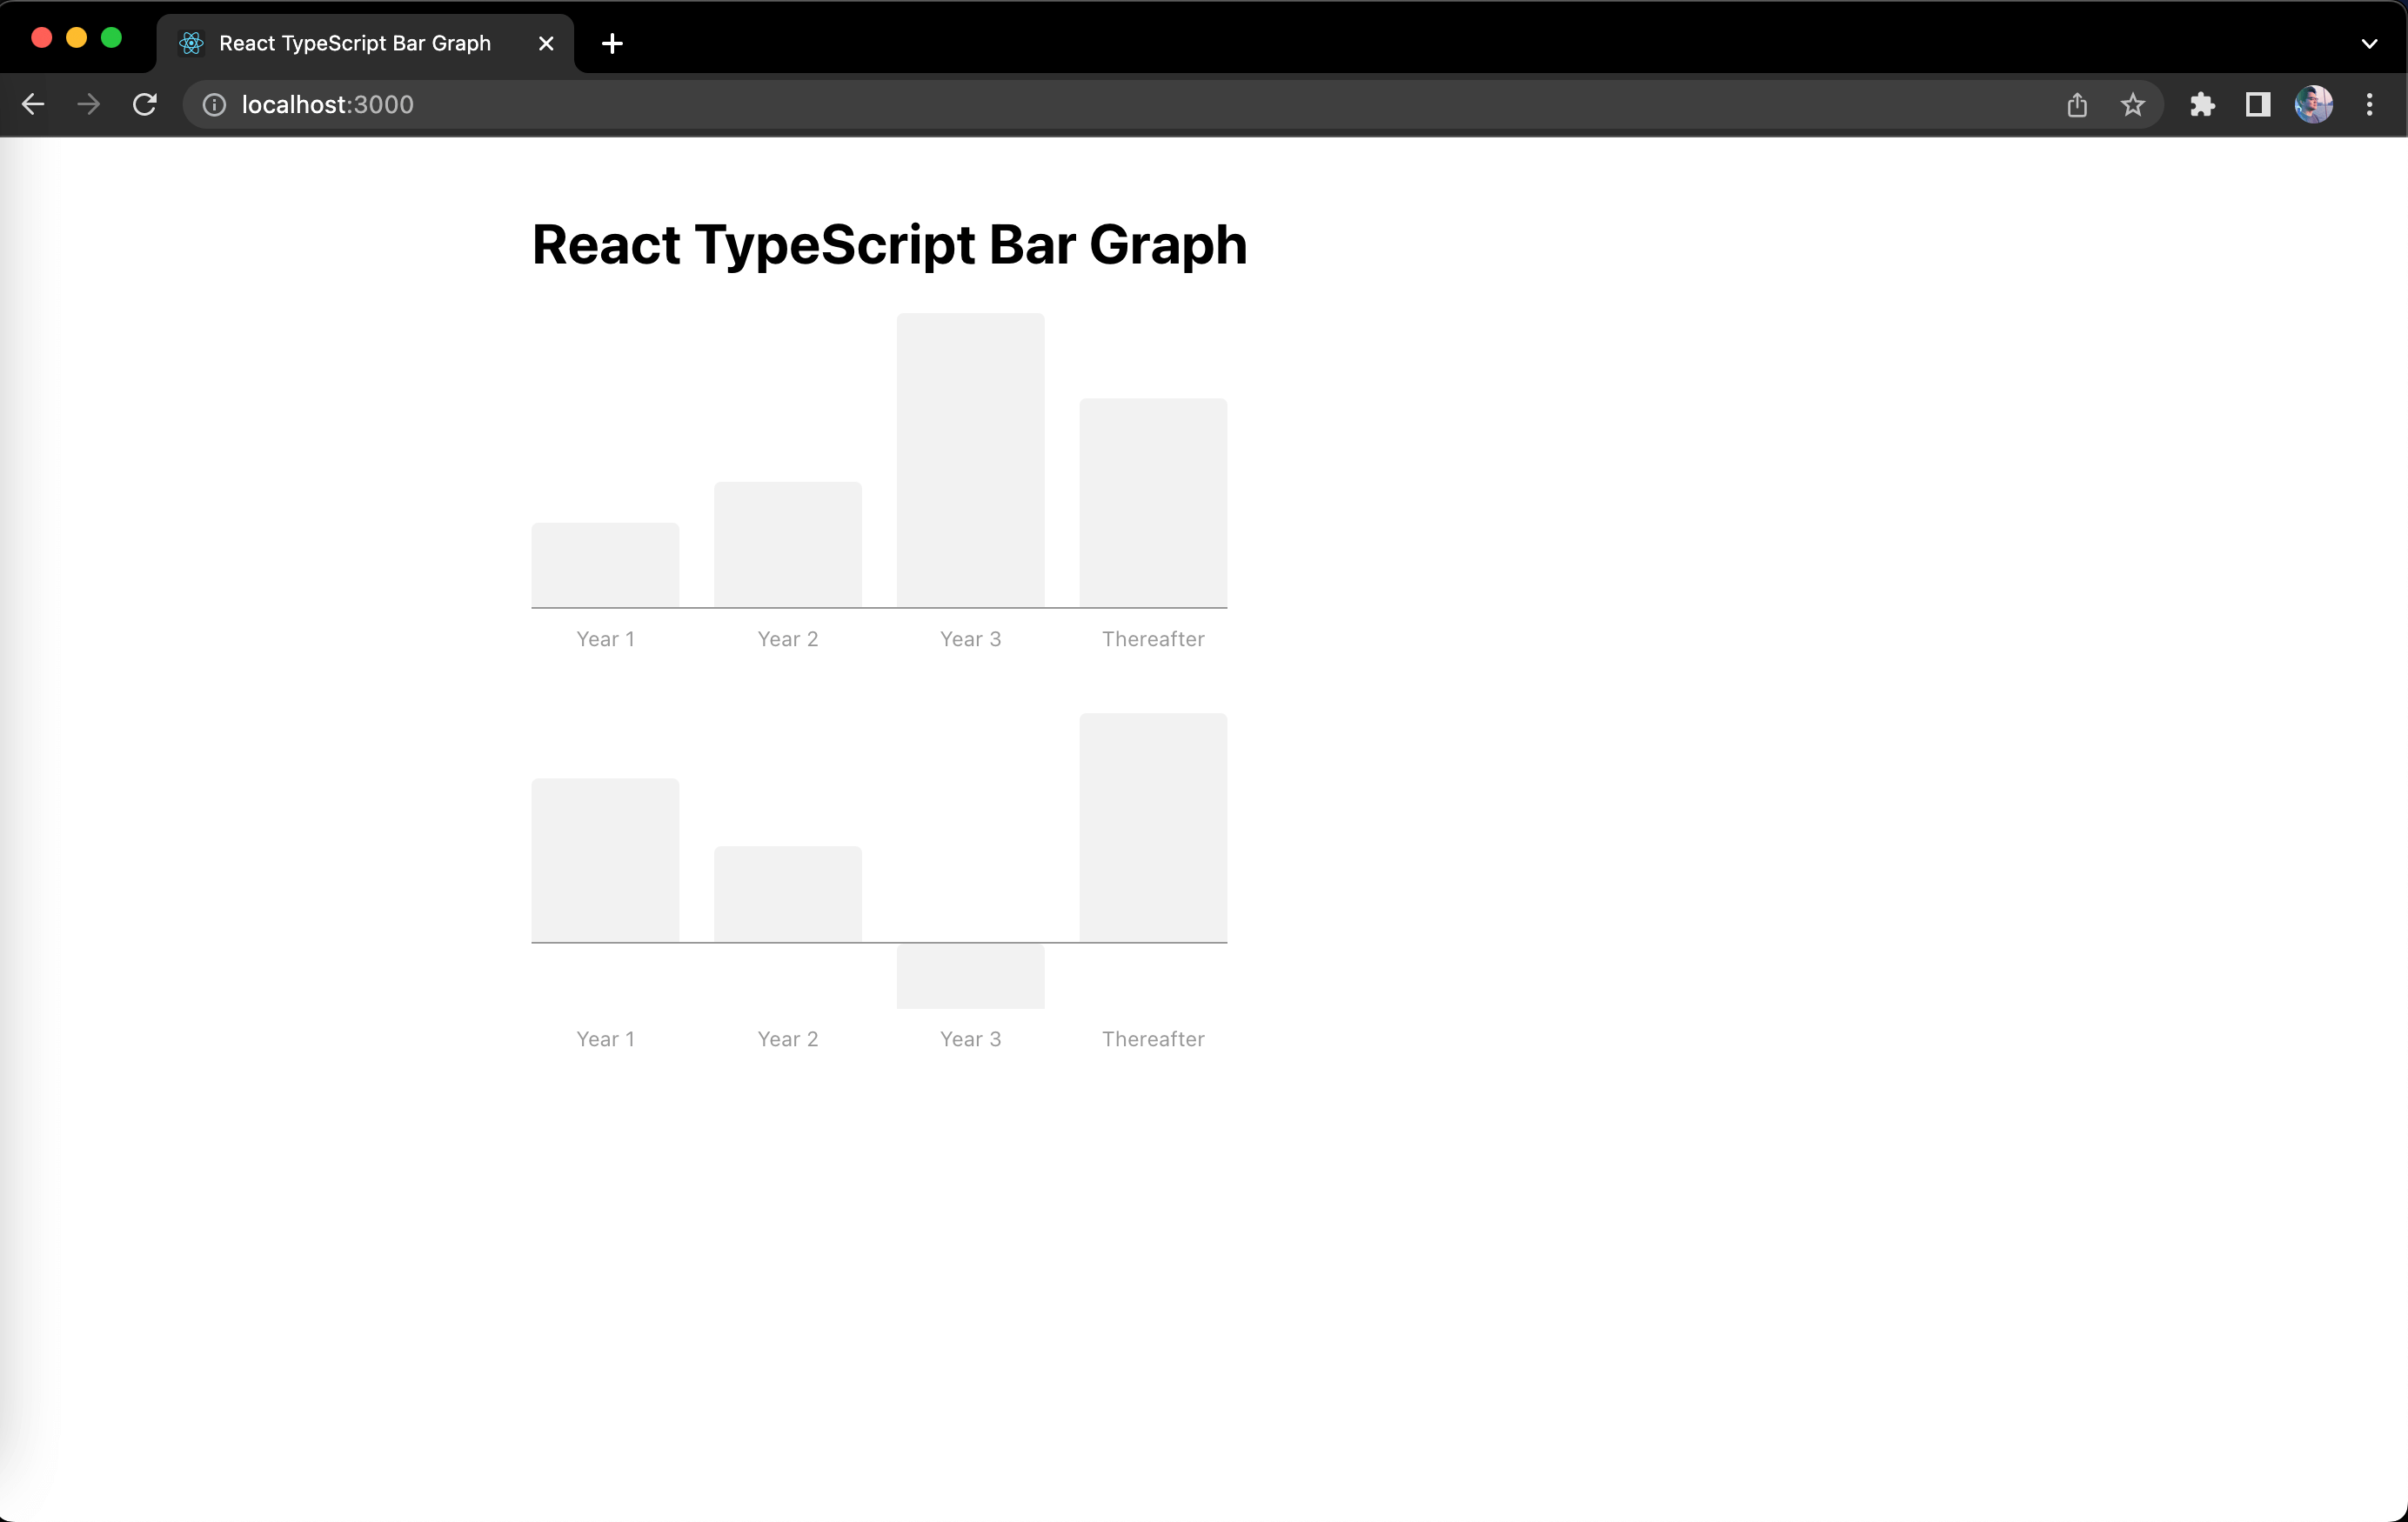
Here's what happens when we save the changes above:
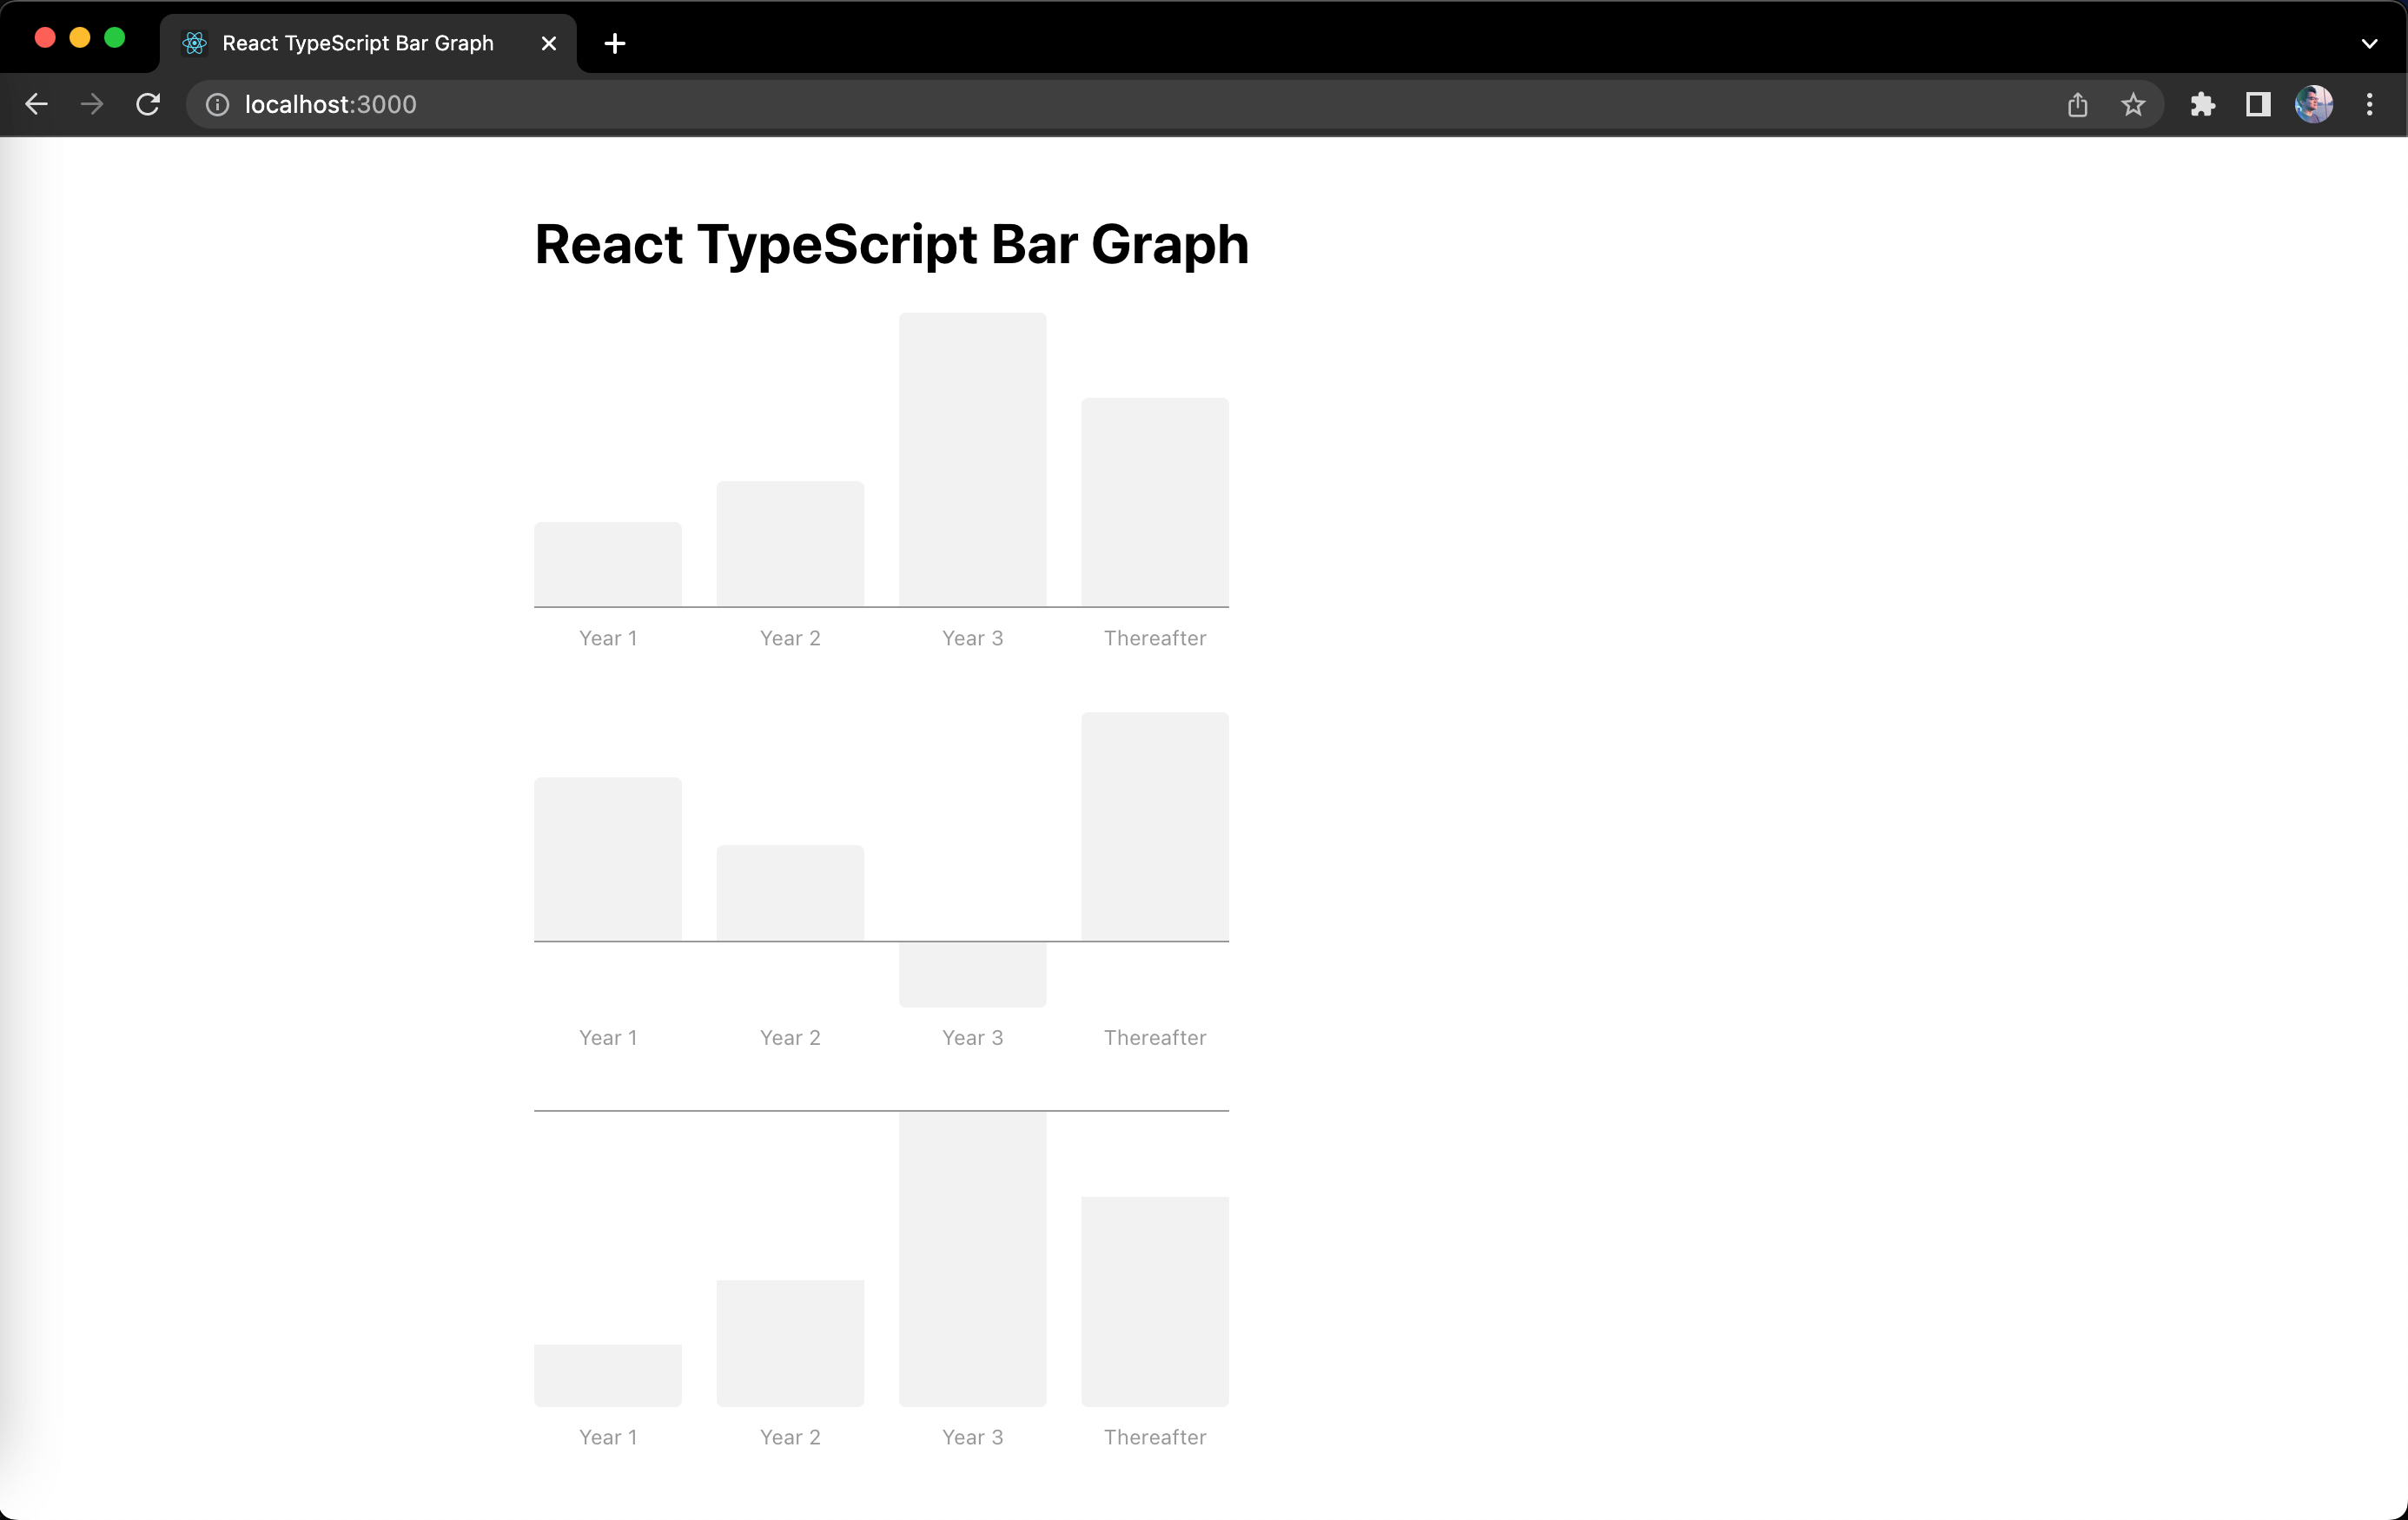
As you can see from the screenshot, only the highest negative value is sticking to the line bar while the smaller negative values are at the bottom. This is because we're setting the risePercentage of all negative values to 0.
How do we determine the correct risePercentage for each bar? The trick is in the highest negative value. If you guessed it correctly, we just have to deduct the percentage of each negative value with the percentage of the highest negative value (which is the equivalent value as our line bar's elevation level - barsLinePercent).
Let's do the final update of our BarGraph component with the following:
...
export default function BarGraph({ dataArray }: Props) {
  const [barItems, barsLinePercentage] = useMemo(() => {
    ...
    const barItems = dataArray.map(({ legend, value }) => {
      const isNegative = value < 0;
      const barPercent = Math.round(
        (Math.abs(value) / highestValueTotal) * 100
      );

      return {
        legend,
        isNegative,
        barPercentage: `${barPercent}%`,
        risePercentage: isNegative
          ? `${barsLinePercent - barPercent}%`
          : barsLinePercentage,
      };
    });

    return [barItems, barsLinePercentage];
  }, [dataArray]);

  return (
    ...
  );
}
Don't forget to save the changes and let's see if it's working as expected:
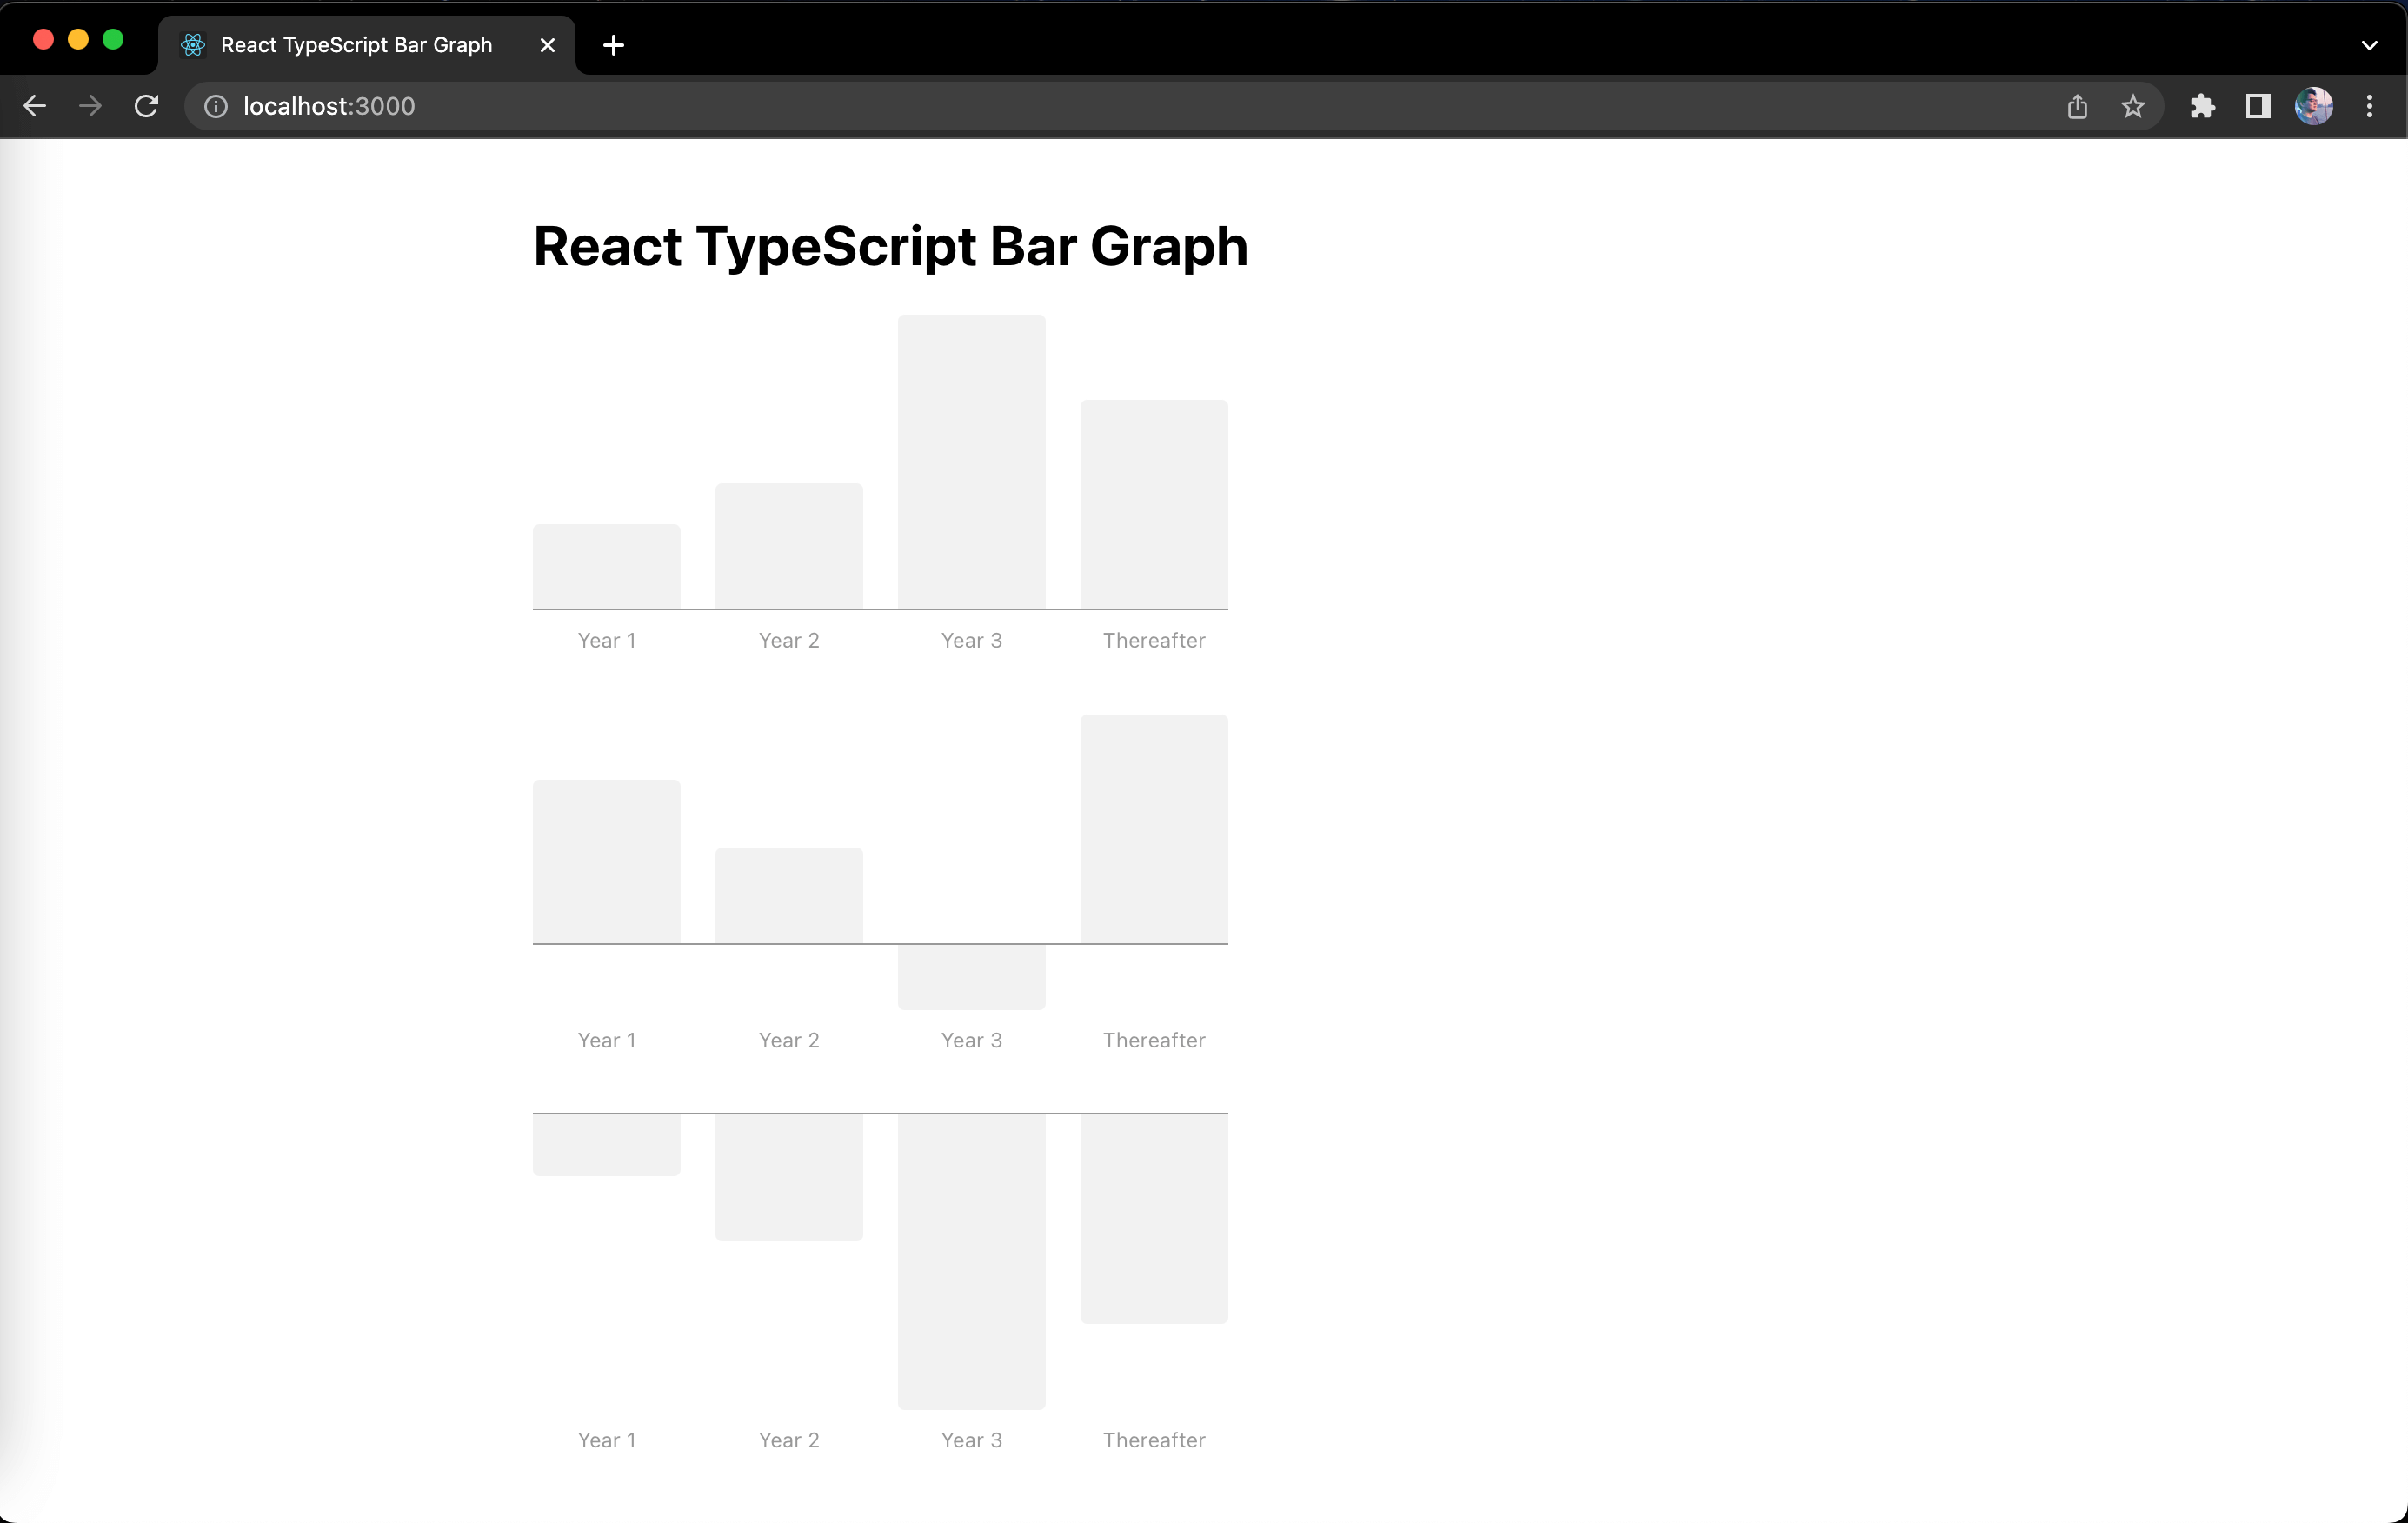
Well, would you look at that? We're done. That's it! We've just built our very own bar graph that can handle positive and negative values in React and TypeScript. Feel free to modify the values and see how our bar graph will display them.
We're now ready to write some tests for this bar graph component. Please proceed to the next part of this post.